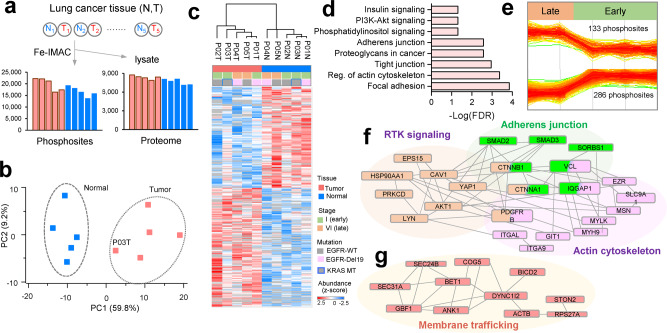
Fig. 6. Phosphoproteome profiling of lung cancer tissues.
a Summary of phosphosite and protein-level identification results in each tumor (T) and adjacent normal (N) lung cancer tissue. b Principal component (PC) analysis of tumor and adjacent normal tissues using differentially expressed sites normalized to protein level (two-sampled t-test, p < 0.05, S0 = 0.1). c Unsupervised clustering of 585 (normalized) differentially expressed phosphosites between tumor and normal tissues (two-sampled t-test, p < 0.05, S0 = 0.1). d Pathway analysis of upregulated phosphosites by the Kyoto Encyclopedia of Genes and Genomes (KEGG) database (FDR < 0.05). e Differentially expressed phosphosites showing increasing or decreasing expression between early and late stages (two-sampled t-test, p < 0.05, S0 = 0.1). Protein–protein interaction network and functional category of phosphoproteins for f upregulated in the early and g upregulated in late stages filtered with medium confidence and FDR < 0.05 in STRING database (https://string-db.org/). Source data are provided as a Source Data file.

