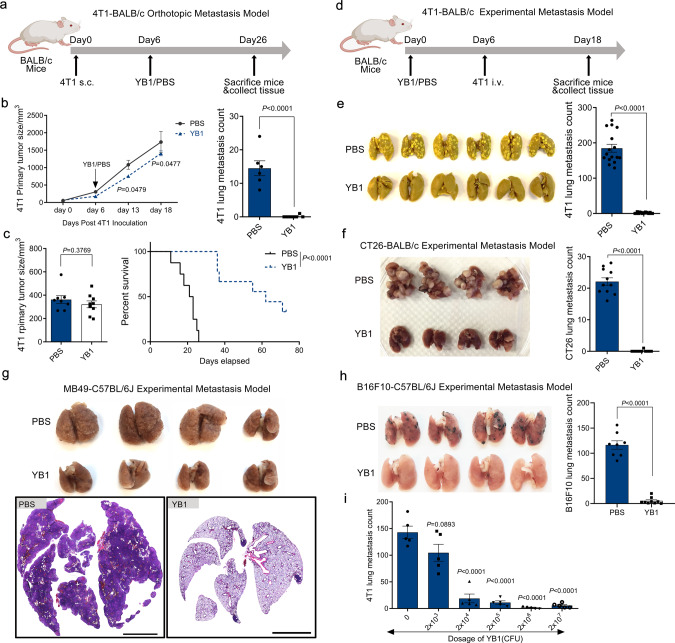
Fig. 1. Salmonella YB1 treatment inhibits cancer metastasis in multiple syngeneic mouse tumor models.
a Overall procedures to establish 4T1-BALB/c orthotopic metastasis model. Cancer cell inoculation was followed by treatment with YB1 or PBS. b Quantification of 4T1 primary tumor size (two-sided multiple t-tests) and relevant lung metastasis (unpaired two-tailed t-test) after YB1 treatment in the 4T1-BALB/c orthotopic metastasis model (n = 6 PBS, n = 7 YB1). c Mice tumor size measured (unpaired two-tailed t-test) before surgical removal of 4T1 primary tumors and relevant Kaplan–Meier survival curve (log-rank test) of these mice (n = 8 PBS, n = 9 YB1). d Procedure to establish 4T1-BALB/c experimental metastasis model. 4T1 cells were i.v. injected into BALB/c mice pretreated with YB1 or PBS. e Picture of lungs fixed in Bouin solution and quantification (unpaired two-tailed t-test, displayed is a combined result of three independent experiments, n = 16 per group) of 4T1 lung metastases after YB1 treatment in the 4T1-BALB/c experimental metastasis model. f Picture of lungs and quantification (unpaired two-tailed t-test, n = 11 per group) of lung metastases after YB1 treatment in an experimental metastasis model established by colon cancer (CT26) in BALB/c mice. g Picture of 4% PFA-fixed lungs and representative H&E staining of lung tissue in an experimental metastasis model established by bladder cancer (MB49) in C57BL/6J mice (n = 4 mice per group). Scale bar, 3 mm. Condensed tumor nodules were stained with H&E from PBS samples. h Picture of lungs and quantification (unpaired two-tailed t-tests) of lung metastases after YB1 treatment in the experimental metastasis model established by inoculation of melanoma (B16F10) in C57BL/6J mice (n = 8 PBS, n = 9 YB1). i Quantification of 4T1 lung metastases in the 4T1-BALB/c experimental metastasis model after treatment with different doses of YB1 (n = 5 per group). P-values are comparisons between no YB1 treatment and different dosages of YB1 treatment using unpaired two-tailed t-tests. Graphs and images presented are one representative experiment of two independent experiments (b, c, g, i). Graph presented is a combined result of two independent experiments (f, h). All data are presented as mean values ± SEM. Source data are provided as a Source Data file.

