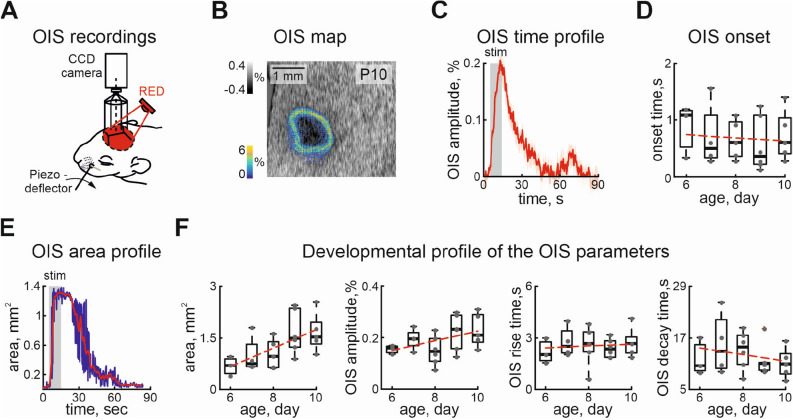
Figure 1.
Evoked optical intrinsic signal in the somatosensory cortex of the neonatal rat. (A) Diagram of the experimental setup for recording evoked OIS in the barrel cortex of the neonatal rat, (B) color-coded density map of the detected OIS contours overlaid on the recorded OIS, seen as a dark spot, (C) example of the temporal profile of the OIS recorded using red light, stimulation period is shown by the grey rectangle, mean OIS dynamic is shown by the red line, the shaded area corresponds to the confidence interval, (D) developmental changes in OIS onset (0 is the start of stimulation), (E) example of OIS area changes during recording is shown by the blue line, the red line is a result of convolution with a Kaiser window of 12 points size, (F) developmental changes in the evoked OIS area, amplitude, rise and decay times. The red dashed line is a linear fit. Grey dots are results from individual experiments. Box plots show median (bold black line), the bottom and top edges of the box indicate the 25th and 75th percentiles, The whiskers extend to the most extreme data points not considered outliers, and the outliers are plotted individually using the ’+’ symbol.

