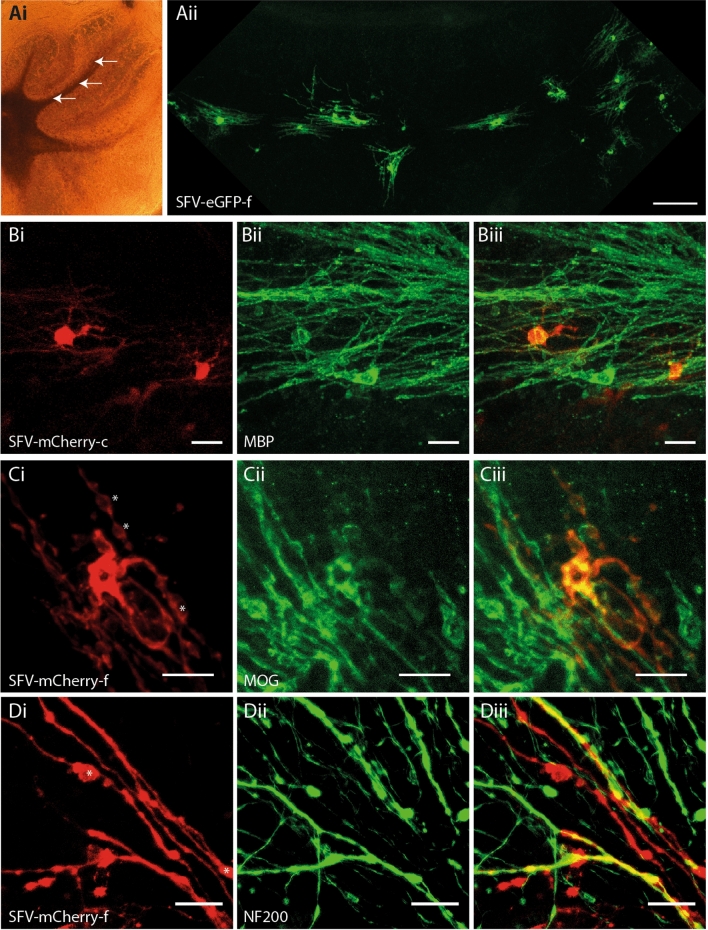
Figure 1.
SFV transduces myelinating OL in cerebellar slice cultures. (Ai) Phase contrast image of a cerebellar slice culture illustrating white matter tracks and typical sites for SFV injections (arrows). (Aii) OL with a myelinating morphology are labelled throughout the entire white matter track of one folium 24 h after injection of SFV encoding eGFP-f. Magnification 10 ×, Scale bar 100 µm. (B) SFV labelled OL express MBP. (Bi) Cytoplasmic mCherry (mCherry-c) in two white matter cells with typical myelinating OL morphology. (Bii) MBP immunofluorescence in the field shown in (Bi). (Biii) Merged image indicating localization of anti-MBP (green) to the processes of the mCherry+ (red) cells depicted in (Bi). Magnification 20 ×, Scale bars in (B) panels 20 µm. C. SFV labelled cells localize MOG. (Ci) mCherry-f labelled white matter glial cell with myelinating morphology. (Cii) MOG immunofluorescence in the field shown in (Ci). (Ciii) Combined mCherry and MOG signals indicate colocalization of anti-MOG (green) and mCherry (red) signals. Magnification 40 ×, Scale bars in (C) panels 20 µm. (D) Axonal interactions of SFV labelled OL. (Di) High power (40 ×) image of processes (red) extending from an OL transduced with SFV-mCherry-f. (Dii) Axons (green) from the field depicted in Di labelled with anti-NF200. (Diii) Merge image indicating localisation of NF200 on SFV labelled processes (yellow). Asterisks in Ci and Di indicate mCherry-f labelled membrane bubbles. Scale bars in (D) panels 20 µm.

