Figure 3.
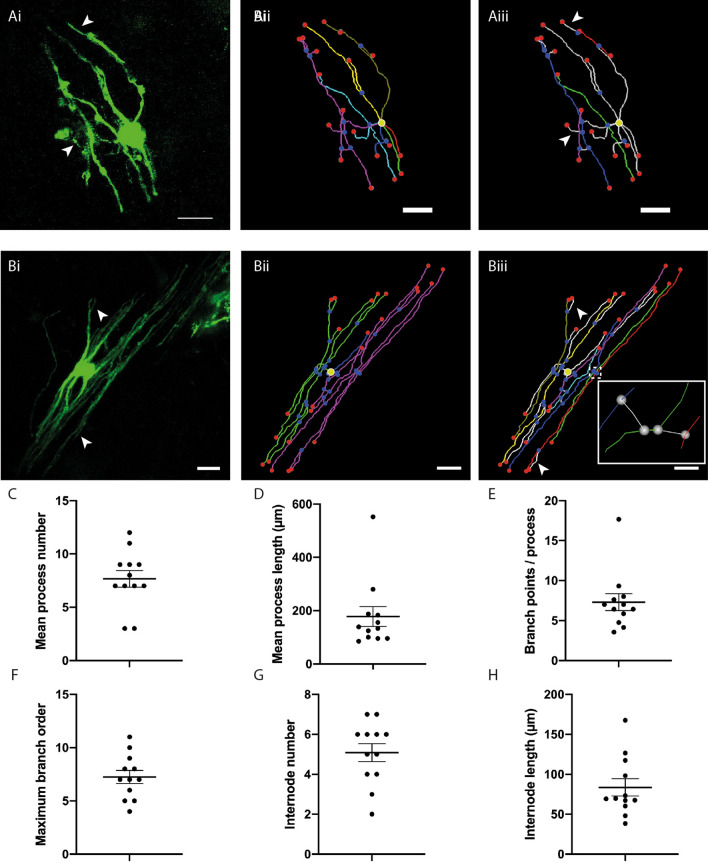
3-D reconstructions of SFV-labelled OL and quantification of OL process morphology. (Ai) Maximum projection showing eGFP-f expression in a relatively simple white matter OL transduced with SFVA7(74). (Aii) 3-D reconstruction of the cell shown in (Ai). Segment colours (cyan, blue, green, yellow, gold, red, purple) indicate seven individual process arbors. Yellow circle indicates position of cell body. (Aiii) Reconstruction of the cell shown in (Ai) indicating position of four identified internodes (blue, purple, green, red). (Bi) Maximum projection showing eGFP-f expression in a relatively complex OL. (Bii) 3-D reconstruction for the cell shown in (Bi). Segment colours (blue, green, purple) indicate three individual process arbors. (Biii) Reconstruction of the cell shown in Bi indicating seven putative internodes (cyan, blue, green, yellow, gold, purple, red). Individual processes (green and purple in Bii) support multiple putative internodes. Inset: Expanded view of area indicated by dashed box reveals the initiation of internodes from neighboring internodes via fine connecting processes (white segments). Scale bars in (A) and (B) 20 µm. (C–H) Scatter plots displaying features of OL process morphology: mean process number per OL (7.67 ± 0.78) (C), mean process length (178 ± 37.5 µm) (D), average branch points per process (7.3 ± 1.05) (E), maximum branch order per process (7.25 ± 0.60) (F), mean internode number per cell 5.08 ± 0.45 (G), and mean internode length (83.7 ± 10.71 µm) (H). Arrows in (Ai)/(Aiii) and (Bi)/(Biii) indicate fine branches stemming from putative internodes. In (Aii–iii) and (Bii–iii) red and blue spheres indicate segment end-points and junction points respectively. Yellow circles indicate position of cell body. Data expressed as means ± SEM.

