Figure 6.
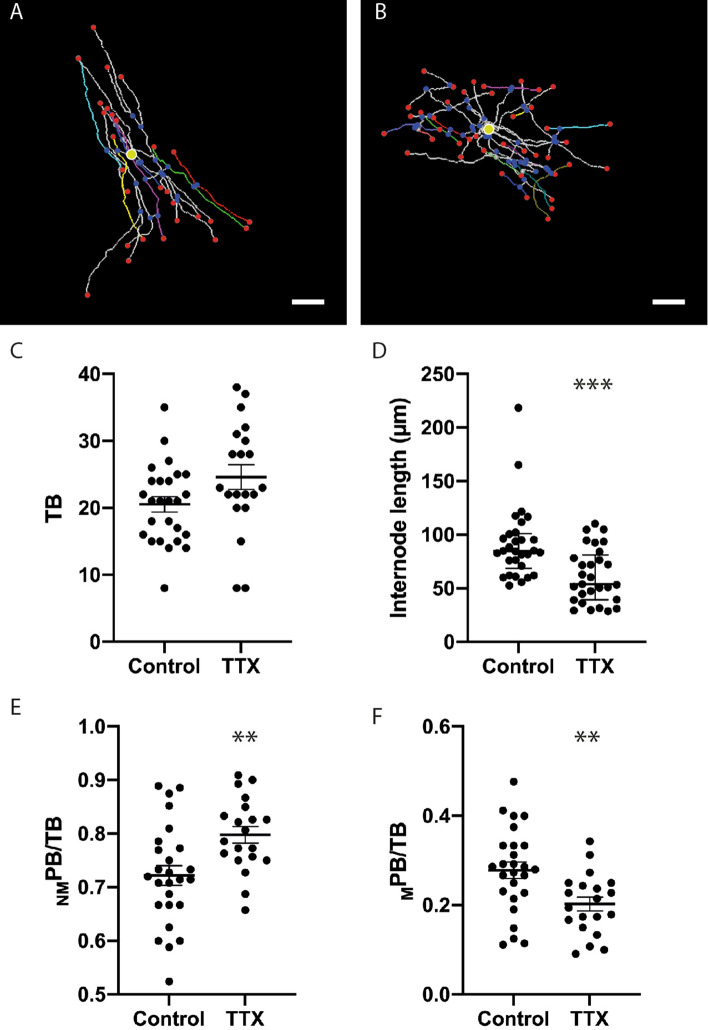
Sustained inhibition of neuronal activity alters OL morphology. (A,B) Representative 3-D reconstructions of OL from control (A) and TTX (B) treated cerebellar slices showing internodes selected for quantification (A cyan, blue, green, red; B blue, green, red) and cell bodies (yellow circles). (C) Tendency towards an increased numbers of branches per cell for TTX treated TOL (Control 20.5 ± 1.15, TTX 24.6 ± 1.86). (D) TTX treatment reduced the median internode length of TOL (Control 84.7 µm (68.6–101), TTX 53.8 µm (39.3–81.2). (E,F) TTX treatment induced complementary changes in the ratio NMPB/TB (E) (Control 0.72 ± 0.02, TTX 0.80 ± 0.02) and MPB/TB (F) (Control 0.28 ± 0.02, TTX 0.20 ± 0.02). Scale bars in (A) and (B) 20 µm. ** Significance P < 0.01, *** Significance P < 0.001. In (A) and (B) red and blue spheres indicate segment end-point and junction points respectively. Yellow circles indicate position of cell body. Data in (C), (E) and (F) expressed as means ± SEM, data in (D) expressed as median ± interquartile range.

