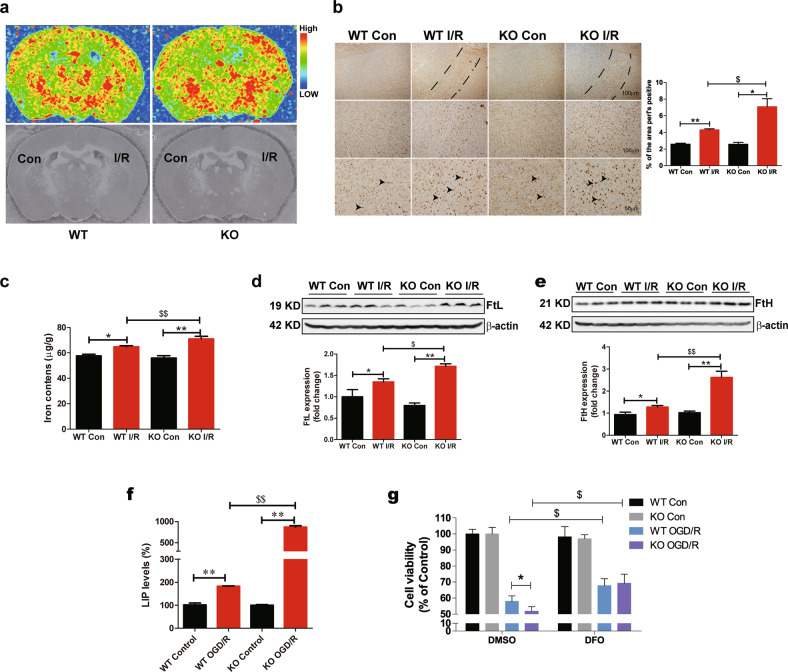
Fig. 5. Deletion of FtMt leads to an elevation in iron after cerebral I/R.
a Distribution of iron in the mouse brain after I/R. The upper images show the mapping results with μ-XRF, and the iron levels in different brain regions are indicated by different colours. Blue indicates the lowest iron level, and red indicates the highest iron level, as shown in the illustration. The lower images show the morphology of the brain sections corresponding to the upper images (n = 3). b Content and distribution of iron as determined by DAB-enhanced Perl’s staining and quantification of the area of Perl’s staining in brain sections from mice of different groups (n = 3). The dotted zone indicates the penumbra. The arrowheads indicate positive staining of iron. c Iron content as determined by ICP-MS in wild-type and Ftmt-knockout mice 24 h after MCAO/reperfusion (n = 6). Western blot analysis of the iron storage proteins (d) FtL and (e) FtH (n = 5). f Primary cultured wild-type and Ftmt-knockout neurons were subjected to OGD for 5 h and reperfusion for 18 h, and the LIP levels were determined (n = 4). g Primary cultured wild-type and Ftmt-knockout neurons were subjected to OGD treatment for 5 h and then exposed to normal medium with 0.05 μm DFO for 18 h. Cell viability was determined using an MTT assay (n = 6). The results are presented as the mean ± SEM. */$P < 0.05, **/$$P < 0.01.

