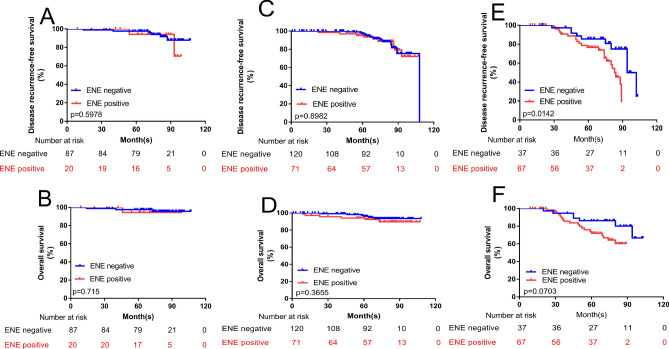
Figure 4.
Kaplan–Meier curves and Log-rank test show associations of ENE in ALN with DRFS and OS in whole patients with different nodal (N) stage. (A,B) Comparison of survival rate for DRFS (ENE negative group vs. ENE positive group: p = 0.557) (A) and OS (ENE negative group vs. ENE positive group: p = 0.547) (B) between different ENE groups in patients with N1 stage. (C,D) Comparison of survival rate for DRFS (ENE negative group vs. ENE positive group: p = 0.919) (C) and OS (ENE negative group vs. ENE positive group: p = 0.367) (D) between different ENE groups in patients with N2 stage. (E–F) Comparison of survival rate for DRFS (ENE negative group vs. ENE positive group: p = 0.047) (E) and OS (ENE negative group vs. ENE positive group: p = 0.346) (F) between different ENE groups in patients with N3 stage.

