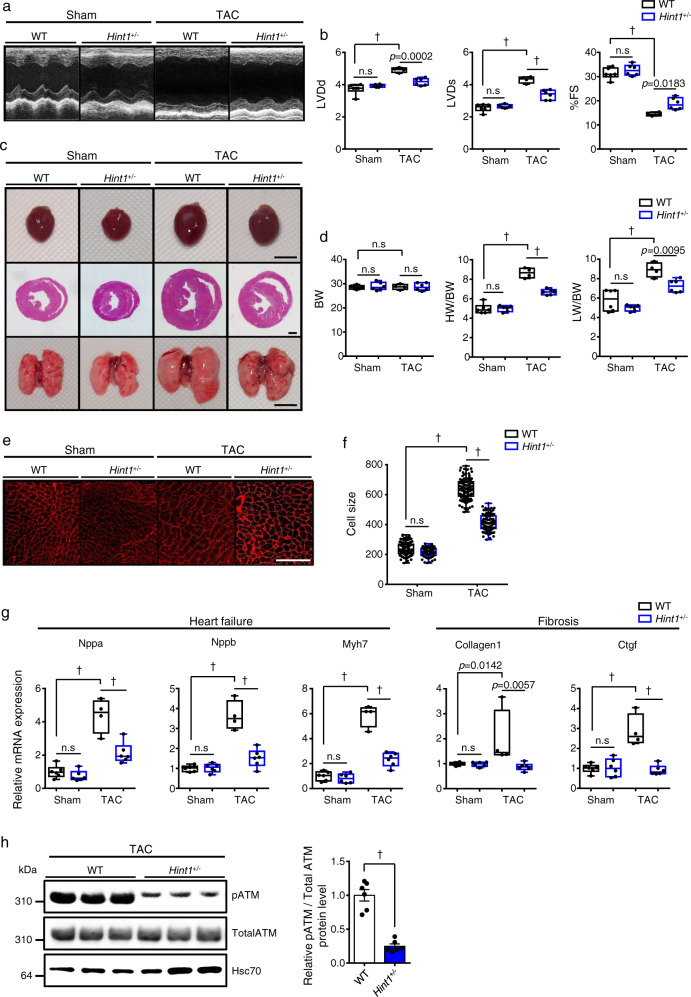
Fig. 7. Hint1-deficient mice are resistant to HF development.
a Representative M-mode echocardiography recordings from Hint1+/− and WT littermate mice, 6 weeks after TAC or sham surgery. b Left ventricular end-diastolic diameter (LVDd) (mm) (left), left ventricular end-systolic diameter (LVDs) (mm) (middle), and percent fractional shortening (%FS) (right) in indicated mice (WT TAC: n = 4, other groups: n = 6 each). c Gross appearance of whole heart (top row; scale bar, 5 mm), hematoxylin-eosin (HE)-stained sections of the mid-portion of the heart (middle row; scale bar, 1 mm), and gross appearance of the whole lung (bottom row; scale bar, 5 mm). d Body weight (BW) (g) (left), HW/BW ratio (mg/g) (middle), and lung weight per body weight ratio (LW/BW) (mg/g) (right) in indicated mice (WT TAC: n = 4, other groups: n = 6 each). e Shown are representative left ventricle sections stained with wheat germ agglutinin (WGA) as an indicator of cardiomyocyte size (scale bar, 100 μm). f Distribution of myocardial cell size (μm2) in indicated mice (WT sham: n = 117 cells, Hint1+/− sham: n = 113 cells, WT TAC: n = 112 cells, Hint1+/− TAC: n = 116 cells). g Relative expression of genes associated with heart failure and fibrosis in hearts of indicated mice (WT TAC: n = 4, other groups: n = 6 each). Levels seen in sham-operated WT mice were set to 1. h, Representative western blot (left) and pATM/total ATM ratio (right) in heart tissues of WT or Hint1+/− littermate mice, 6 weeks after TAC operation (n = 6 per group). Hsc70 served as a loading control. Values derived from TAC-operated WT mouse heart tissue were set to 1. Box plots for b, d, f, and g present min to max, median, and all points. For h, data show mean ± SD and all points. Statistical significance was determined by one-way ANOVA with Sidak’s post hoc test (b, d, f, and g) or two-sided unpaired Student’s t-test (h). †p < 0.0001, n.s; not significant, between genotypes or groups.

