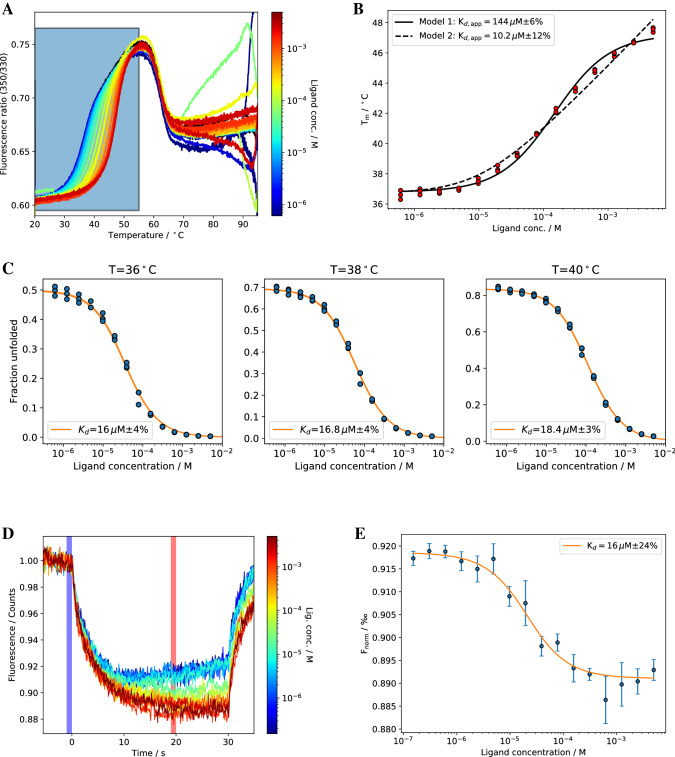
Figure 6.
(A) nDSF signal (fluorescence ratio) for Pcs60/γS-ATP titration. The region in the colored box was used for isothermal analysis (shown in C). (B) Melting temperature analysis with two different models yields apparent Kd,app values. (C) Isothermal analysis of nDSF data for ∆Cp = 0 at three selected temperatures. The same analysis for a fitted ∆Cp (cf. Table 1) is shown in supplementary information S28. (D) MST experiment with Pcs60/γS-ATP. The “cold” and “hot” regions used for calculating Fnorm are marked as blue and red shadows, respectively. (E) Fitting Fnorm to a 1:1 model yields a Kd of 16 µM.

