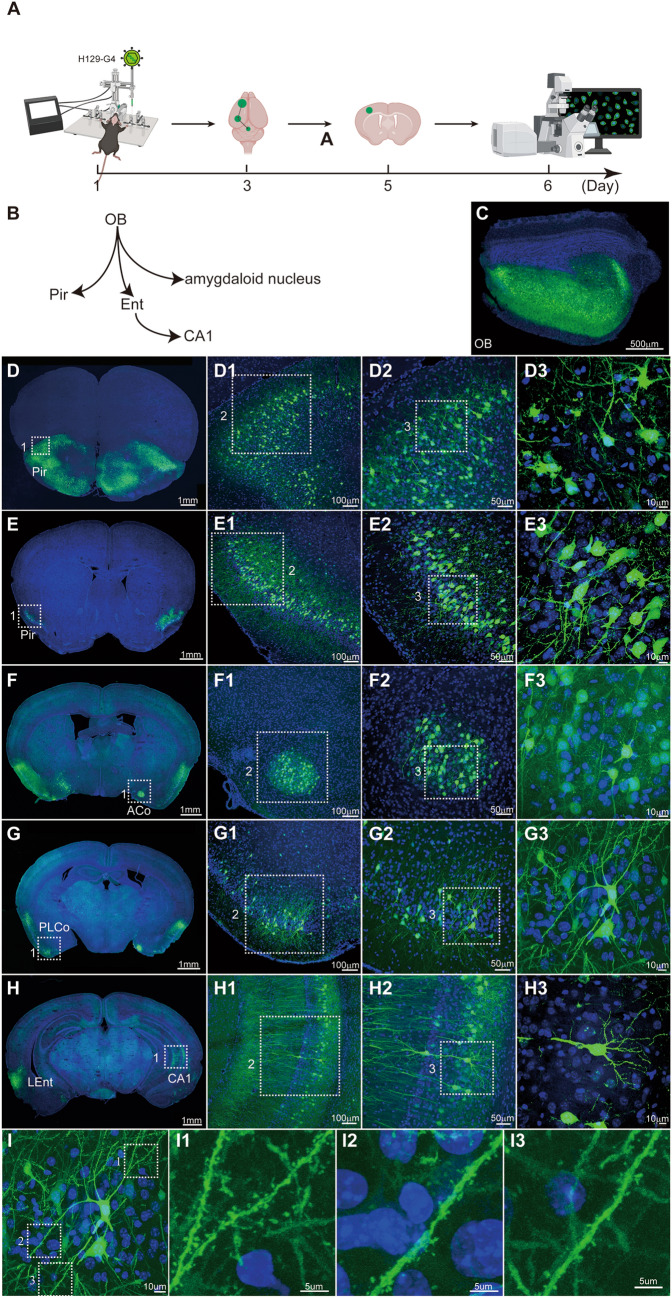
Fig. 3.
Mapping the output pathways of the olfactory bulb (OB) with the polysynaptic anterograde tracer H129-G4. A Timeline for tracing the OB output pathways with H129-G4. B Schema of the simplified OB projection pathways. OB, olfactory bulb; Pir, piriform cortex; Ent, entorhinal cortex; CA1, field CA1 of the hippocampus. C Representative image of a H129-G4 injection site in the OB. H129-G4, 5.0 × 10⁹ pfu/mL, 400 nL, perfusion time: day 3. D–H Representative images of H129-G4-labeled downstream regions. The boxed areas are presented in the right panels at a higher magnification. Coronal brain slices were counterstained with DAPI. ACo, anterior cortical amygdaloid nucleus; PLCo, posterolateral cortical amygdaloid nucleus; LEnt, lateral entorhinal. I Reconstruction of a H129-G4-labeled neuron with fine structural details. A representative GFP-labeled neuron in PLCo is shown, and the magnified images of the dendritic segments are presented in the right panels (I1–I3).

