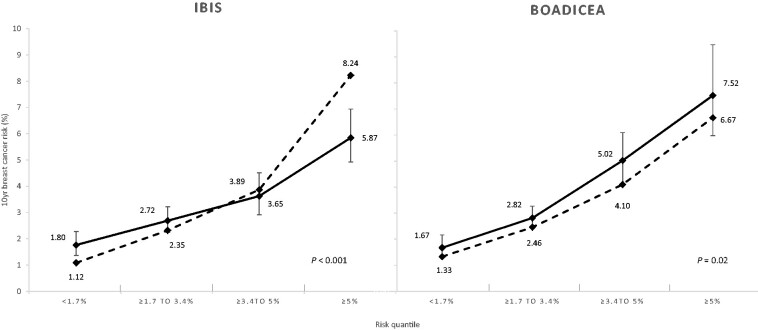
Figure 1.
Calibration of 10-year breast cancer risk scores for IBIS and BOADICEA models by quantile of risk. The dashed line represents the predicted risk. The solid line represents the observed cumulative incidence. The models include age, family history, lifestyle factors, and polygenic risk score, based on the case cohort (n = 3098). For more detailed estimates, see Supplementary Table 2 (available online). Categorization is based on the distribution of raw 10-year breast cancer risk for each of the respective risk prediction models. Numbers and estimates are based on up to 10-year breast cancer risk, which has been adjusted for length of follow-up. Two-sided P values represent the Hosmer-Lemeshow test statistic across all 4 risk quantiles. BOADICEA = Breast and Ovarian Analysis of Disease Incidence and Carrier Estimation Algorithm model (version 5.0.0); IBIS = International Breast Cancer Intervention Study model (version 8 b).

