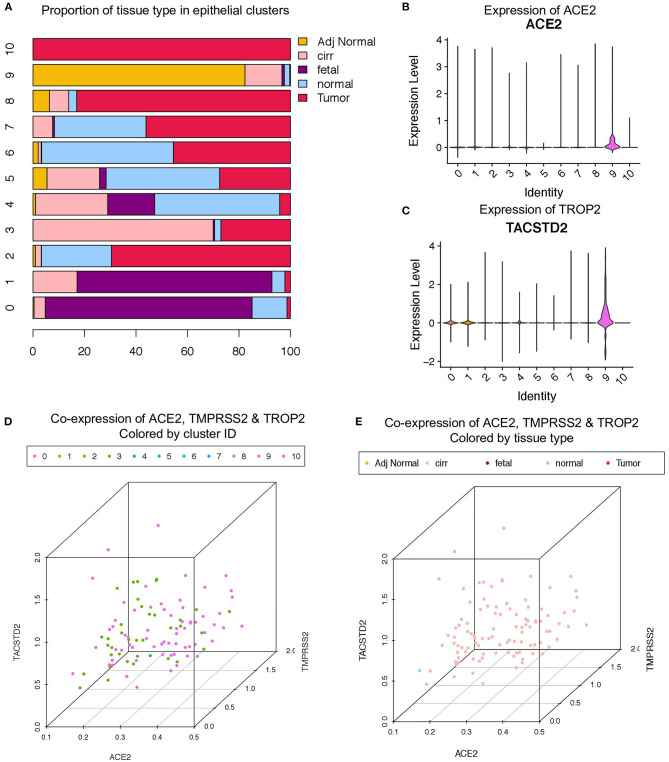
Figure 3.
Co-expression of ACE2, TMPRSS2, and TROP2 in liver epithelial cells. (A) Bar plot depicting the proportion of different tissue types in liver epithelial clusters. Expression of (B) ACE2 and (C) TROP2 in Louvain clusters. Three-dimensional plots of ACE2, TMPRSS2, and TROP2 co-expression (D) colored by Louvain cluster ID and (E) colored by tissue type.

