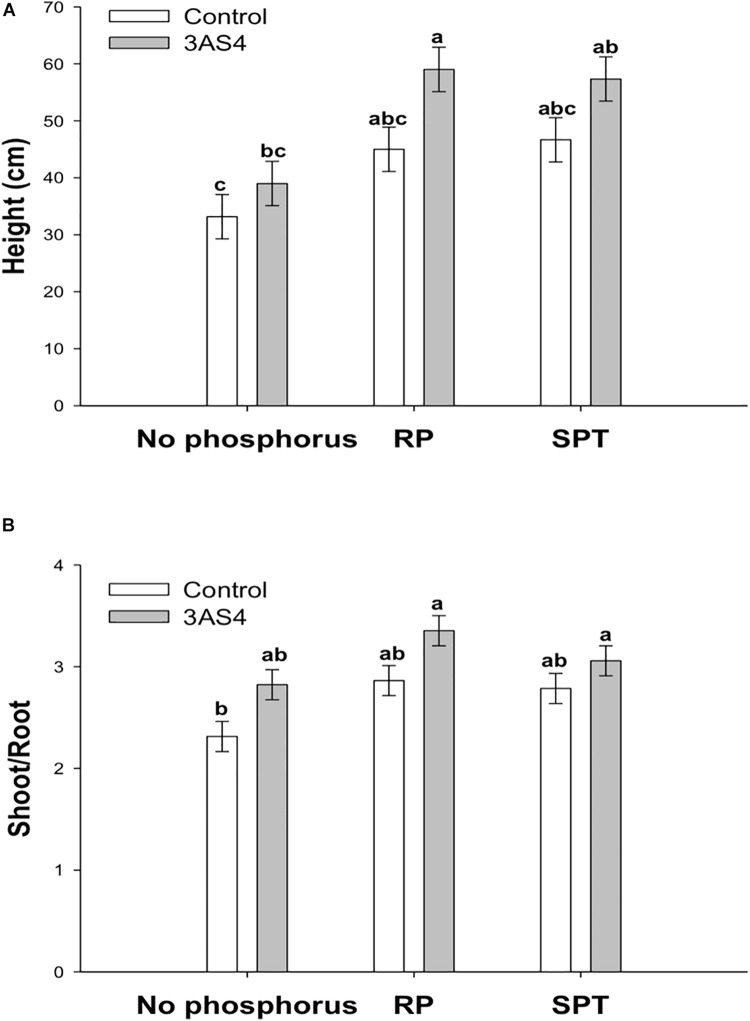
FIGURE 4.
Comparison of the height (A) and shoot:root ratio (B) of the soybean plants inoculated with the 3AS4 strain with two different sources of phosphorus. Rock phosphate (RP) and Single super phosphate (SPT) at 40 kg ha–1. The histograms with the same letter at each case are not significantly different at P < 0.05 (Tukey’s test).

