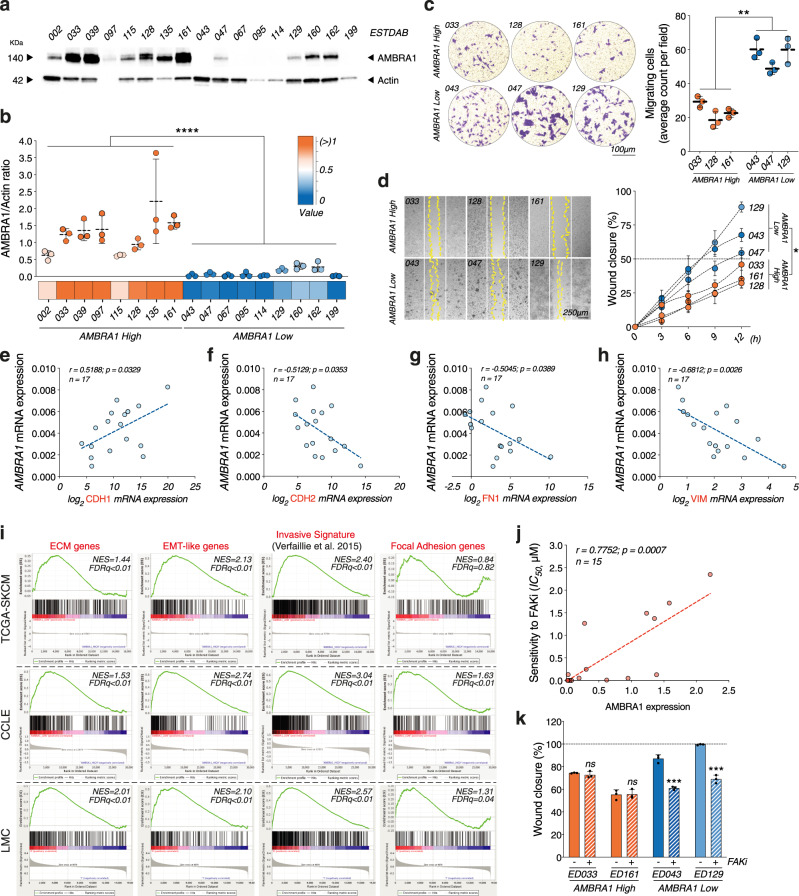
Fig. 6. Low AMBRA1 expression in human melanoma correlates with invasive gene signature and sensitivity to FAKi.
a WB analyses of AMBRA1 in lysates from 17 melanoma cell lines. Actin was used as a loading control. Image is representative of n = 3 gels. b AMBRA1 High and Low groups were determined by densitometric analyses of AMBRA1, expressed as AMBRA1/Actin ratio ± SD (n = 3; ****p < 0.0001, two-tailed unpaired t-test). c Count of migrating AMBRA1 High (n = 3) and Low (n = 3) cells. Data are expressed as mean ± SD and images representative (**p = 0.0026, two-tailed unpaired t-test, AMBRA1 Low vs. AMBRA1 High). d Wound closure of AMBRA1 High (n = 3) and Low (n = 3) cells is shown as percentage ± SD vs. T0 at 12 h. White and yellow lines outline wound edge at T0 and at 24 h. Statistics and representative images are provided at 12 h (*p = 0.0387, two-tailed unpaired t-test, AMBRA1 Low vs. AMBRA1 High). e–h Correlative RT-qPCR analyses of AMBRA1 and e CDH1 (n = 17; r = 0.5188; p = 0.0329, two-tailed Pearson correlation), f CDH2 (n = 17; r = −0.5129; p = 0.0353, two-tailed Pearson correlation), g FN1 (n = 17; r = −0.5045; p = 0.0389, two-tailed Pearson correlation) and h VIM (n = 17; r = −0.6812; p = 0.0026, two-tailed Pearson correlation). Data were normalized to L34. i GSEA of transcriptomic data from melanoma samples of The Cancer Genome Atlas (TCGA-SKCM), melanoma cell lines of The Cancer Cell Line Encyclopedia (CCLE) datasets and melanoma samples of the Leeds Melanoma Cohort (LMC). ECM organization (GO:0030198), Invasive signature19, EMT (Hallmark gene set) and Focal Adhesion Assembly (GO:0005925) gene sets in AMBRA1_Low vs. AMBRA1_High in TCGA-SKCM (n = 70 for each subgroup), CCLE (n = 7 for each subgroup) and LMC (n = 105 for each subgroup). NES, normalized enrichment score; FDR, false discovery rate. j Correlative dose-response analyses between AMBRA1 expression and sensitivity to FAKi (IC50, µM) in n = 15 melanoma cell lines (r = 0.7752; p = 0.0007, two-tailed Pearson correlation). k Area of wound closure of two selected AMBRA1 High and Low cells upon FAKi, shown as percentage ± SD with respect to T0 at 24 h. (n = 3; ***p = 0.0003 for ED043; ***p = 0.0001 for ED129, two-tailed unpaired t-test, FAKi vs. Vehicle).

