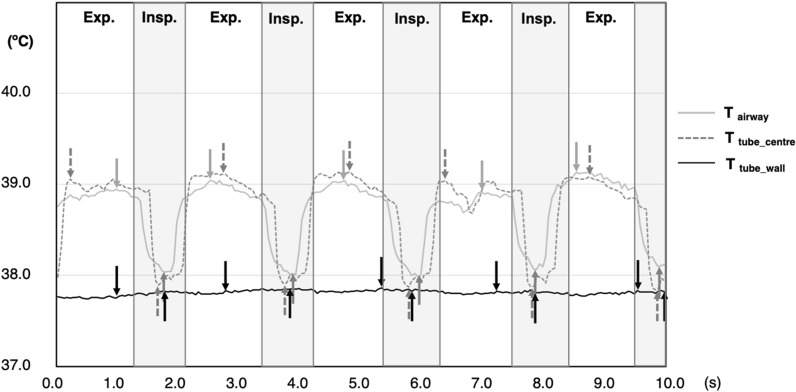
Figure 1.
Representative time-trend data of respiratory gas temperatures. A representative waveform recorded with the following ventilator settings: respiratory rate, 30/min; peak airway pressure, 15 cmH2O; inspiratory time, 0.5 s; positive end-expiratory pressure, 5 cmH2O; and with inflating the endotracheal tube cuff. Tairway and Ttube_centre showed similar waveforms between each other with distinct temperature changes between inspiration and expiration, whereas Ttube_wall showed no apparent temperature changes between inspiration and expiration. Exp. expiratory phase; Insp. inspiratory phase; Tairway airway temperature; Ttube_centre temperature at the centre of the endotracheal tube; and Ttube_wall temperature at the wall surface of the endotracheal tube.

