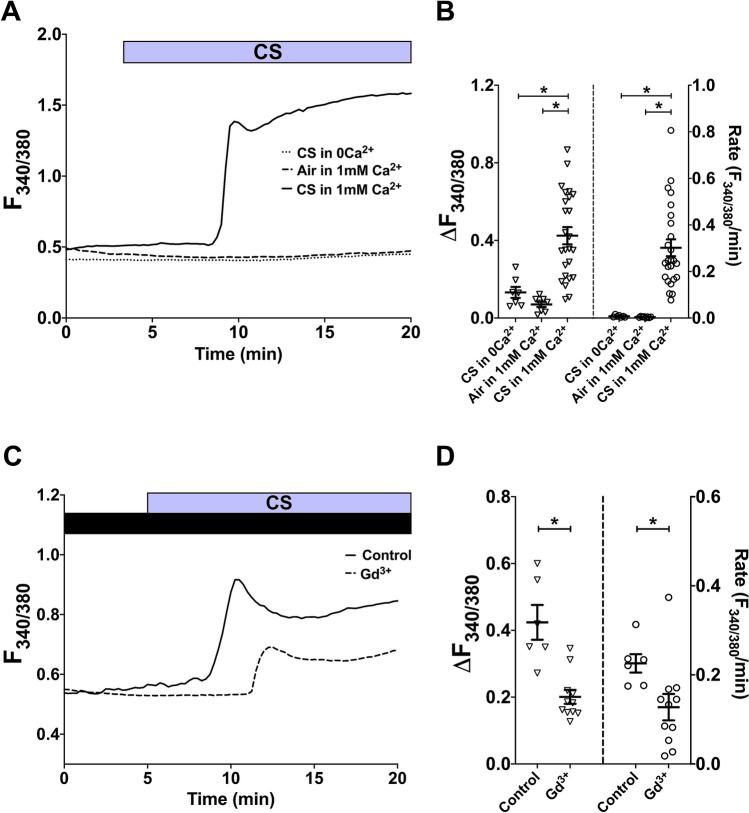
Figure 1.
Whole CS activates Ca2+ influx in hASMC. (A, C) Representative Ca2+ imaging traces from separate experiments tracking changes in [Ca2+]i following puffing one whole cigarette with or without extracellular Ca2+ (A), or with or without 10-min pre-treatment with 500 µM Gd3+, which was also present throughout the experiment (C). (B,D) Summary of amplitude and rate of [Ca2+]i changes corresponding to experiments in (A,C), respectively, presented as mean ± SEM. One-way ANOVA with Holm-Sidak’s multiple comparisons test was performed amongst the 3 groups (B; 4 independent donors; n = 7–25); unpaired t-test was performed between the control group and the Gd3+-treated group (D; 3 independent donors; n = 6–11). * = p < 0.05. Control in (C,D) refers to CS exposure without Gd3+ pre-treatment.

