Figure 7.
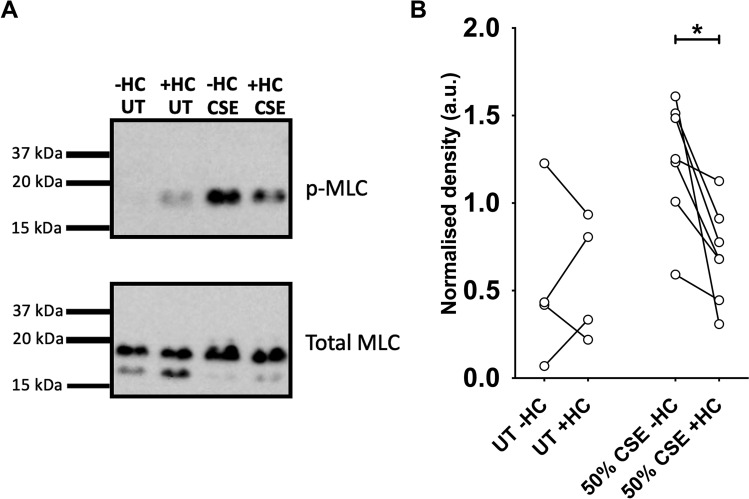
CSE induces MLC phosphorylation in hASMC, downstream of TRPA1-mediated Ca2+ influx. Cells were equilibrated with HEPES-buffered solution for 1 h, and lysed after treatment for protein extraction. For the negative control samples without CSE exposure (UT; untreated), cells were treated with 0.1% DMSO (−HC) or 50 µM HC-030031 (+ HC) for 15 min before lysis. For the CSE experiments, cells were pre-treated with 0.1% DMSO (−HC) or 50 µM HC-030031 (+ HC) for 15 min, and then exposed to 50% CSE, with or without HC-030031, for 2 min before lysis. 15 µg of protein was loaded into each well for gel electrophoresis and western blot analysis. (A) Representative western blot image for MLC phosphorylation assay described above. All 8 lanes shown were part of the same blot, cut vertically to perform staining with two different antibodies. The 4 lanes in the top panel (p-MLC) match the 4 lanes in the bottom panel (total MLC), i.e. the same protein sample run on the same gel, processed under identical blotting and exposure conditions. Full uncropped blots are presented in Supplementary Fig. 1. (B) Semi-quantitative paired comparison of CSE-induced phospho-MLC protein levels, with or without pre-treatment with HC-030031. Band density of p-MLC was normalised to the density of total MLC of the same protein sample (3 independent donors; n = 4–7). *p < 0.05, Wilcoxon matched-pairs signed rank test.

