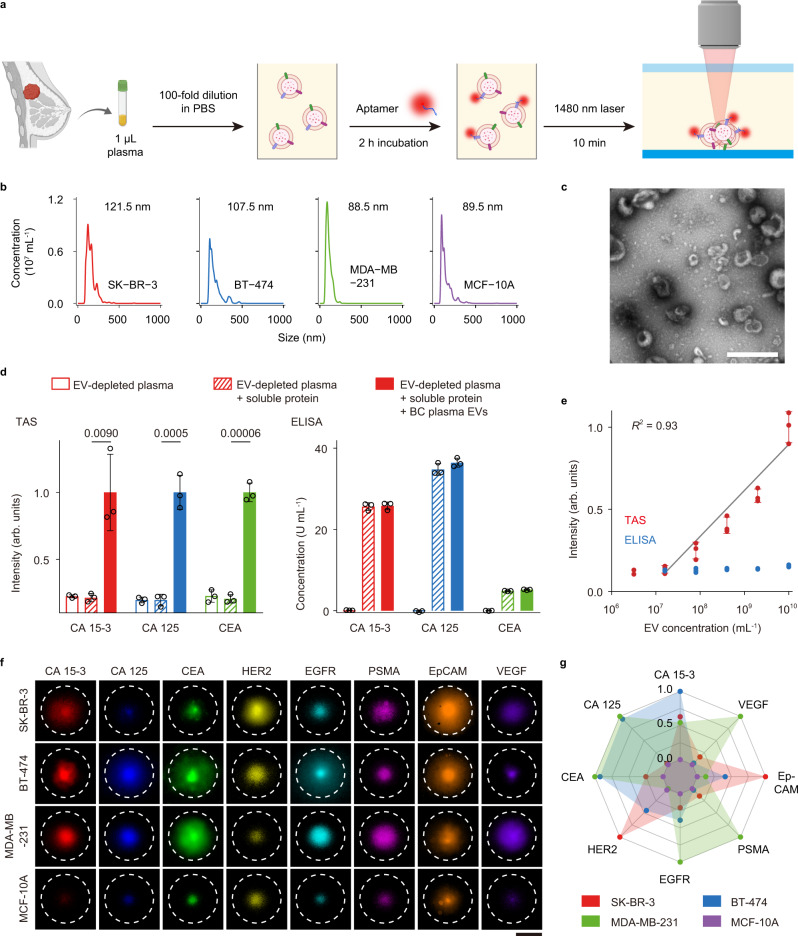
Fig. 1. Thermophoretic aptasensor (TAS) for detecting protein markers of EVs.
a Schematic of the TAS procedure. Clinical plasma samples (1 µL, diluted by 100-folds) were incubated with Cy5-conjugated aptamers to bind to target proteins on EVs, and then subjected to thermophoretic accumulation to amplify the fluorescence signal of aptamer-bound EVs, enabling rapid and sensitive detection of EV protein markers. b Size distribution of EVs derived from three BC cell lines SK-BR-3 (red line), BT-474 (blue line), and MDA-MB-231 (green line), and benign mammary epithelial cell line (MCF-10A, violet line) using nanoparticle tracking analysis (NTA). Size modes are indicated. c Wide-field TEM image of EVs. The representative image is shown from three independent repeats. Scale bar, 500 nm. d TAS and ELISA measurement of expression levels of CA 15-3 (red bars), CA 125 (blue bars), and CEA (green bars) in three types of samples: (i) EV-depleted plasma diluted by 100-folds in 1× PBS; (ii) the diluted EV-depleted plasma spiked with soluble proteins; (iii) the sample ii spiked with plasma EVs (2 × 10⁹ mL−1, n = 3 samples for each protein marker). Statistical difference was determined by a two-sided, parametric t test. P value is indicated in the chart. e Sensitivity of TAS (red dots) and ELISA (blue dots) for the detection of plasma EVs incubated with CEA aptamer (0.1 μM) (n = 3 samples for each EV concentration). R square (R2) is indicated. f Fluorescence images of aptamer-labeled EVs (1010 mL−1) after thermophoretic accumulation showing elevated levels of eight EV protein markers from the three BC cell lines, SK-BR-3, BT-474, and MDA-MB-231, compared to MCF-10A. Scale bar, 50 μm. Images are shown from a single measurement. g Radar plot showing TAS analyses of 8 EV protein markers from the four different cell lines (BT-474 is represented by red dots, SK-BR-3 by blue dots, MDA-MB-231 by green dots, and MCF-10A by violet dots). Error bars represent the mean ± s.d. in (d, e). Source data are provided as a Source Data file.

