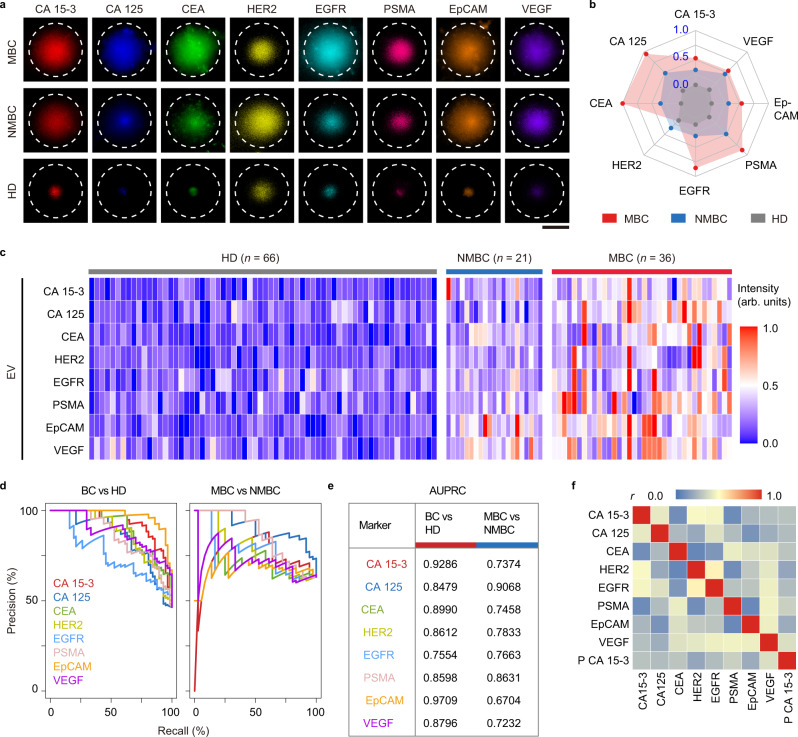
Fig. 2. Profiling of plasma EV proteins from MBC, NMBC, and HD by TAS.
a Fluorescence images showing elevated levels of 8 EV protein markers (CA 15-3, CA 125, CEA, HER2, EGFR, PSMA, EpCAM, and VEGF) in plasma samples from a MBC patient (HR + subtype) and a NMBC patient (HER2 + subtype) compared to HD. Images are shown from a single measurement. Scale bar, 50 μm. b Radar plot showing TAS analyses of eight EV protein markers from MBC (red dots), NMBC (blue dots), and HD (gray dots). c Heatmap of EV protein profiles from 36 MBC patients, 21 NMBC patients, and 66 HD. d Precision-Recall Curves (PRC) for single EV protein markers to differentiate between BC and HD, as well as MBC and NMBC. e Summary of AUPRC (area under the PRC) of single EV protein markers for BC versus HD discrimination and MBC versus NMBC discrimination. f Pearson correlation matrix showing weak correlations between any pair of EV protein markers, as well as between EV markers and plasma CA 15-3. Plasma CA 15-3 is represented as P CA 15-3. Pearson correlation coefficient (r) is indicated. Source data are provided as a Source Data file.

