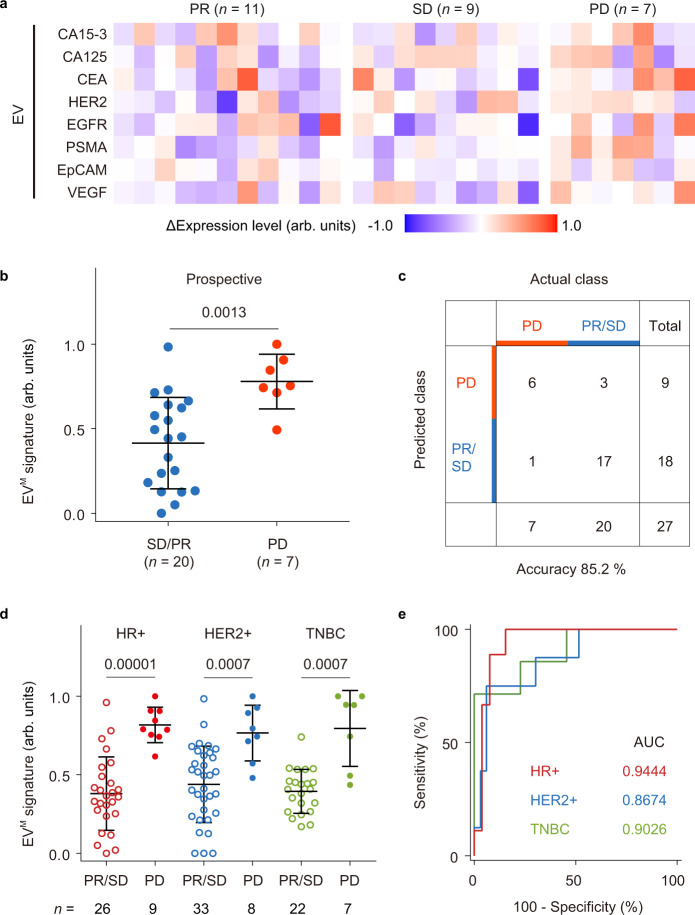
Fig. 5. Prospective cohort of MBC patients for treatment response monitoring.
a Heatmap of ΔIntensity of EV protein markers in patients with PR (n = 11), SD (n = 9), or PD (n = 7). b Values of the EVM signature (the weighted sum of ΔIntensity of eight markers by LDA) for SD/PR (n = 20 samples, blue dots) and PD (n = 7 samples, red dots) groups. c Confusion matrix showing that the EVM signature had an accuracy of 85.2% in differentiating PD from PR/SD. d EVM signature values in the HR + BC group (PR/SD: n = 26 samples, void red dots; PD: n = 9 samples, solid red dots), the HER2 + BC group (PR/SD: n = 33 samples, void blue dots; PD: n = 8 samples, solid blue dots), and the TNBC group (PR/SD: n = 22 samples, void green dots; PD: n = 7 samples, solid green dots). e ROC curves showing similar performance of the EVM signature for classifying treatment response in different BC subtypes (HR + , red line; HER2 + , blue line; TNBC, green line). Statistical differences were determined by two-sided, nonparametric Mann–Whitney test (b, d). P values are indicated in the charts. Error bars represent the mean ± s.d. in (b, d). Source data are provided as a Source Data file.

