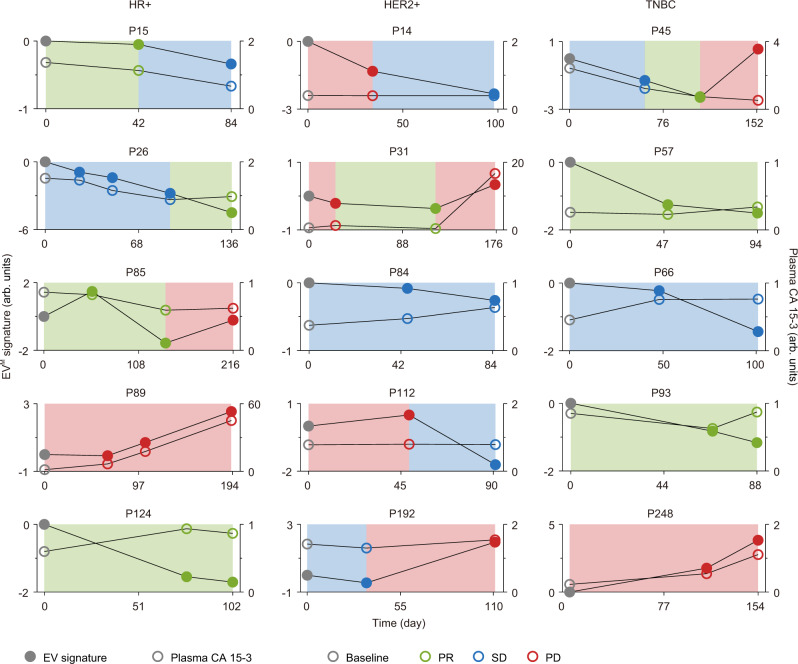
Fig. 6. Comparison of the EVM signature and plasma CA 15-3 in longitudinal monitoring for MBC.
The EVM signature, CA 15-3 level, and therapeutic response were summarized for MBC patients in different BC subtypes (n = 5 for each subtype). The cumulative sum of the EVM signature at each time point was calculated and plasma CA 15-3 level was normalized by the cutoff value of 25 U mL−1. The solid gray, green, blue, and red dots indicate the EVM signature at the baseline, PR, SD, and PD, respectively. The void gray, green, blue, and red dots indicate the plasma CA 15-3 at the baseline, PR, SD, and PD, respectively. Source data are provided as a Source Data file.

