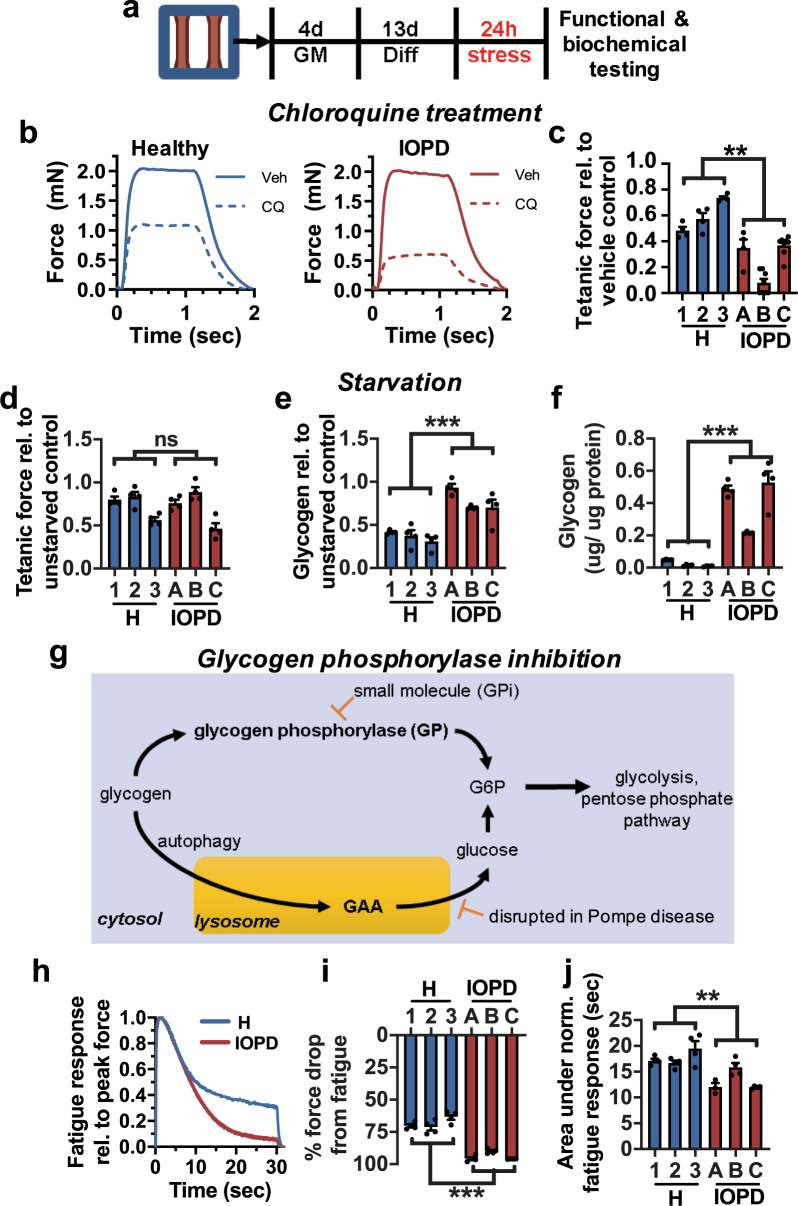
Fig. 3. Response of myobundles to metabolic stress.
a Schematic of experimental design: myobundles were cultured in growth media (GM) for 4 days and then differentiated for 13 days prior to 24 h of stress. b Representative force traces following 24 h of treatment with vehicle (Veh) or 5 µM chloroquine (CQ) in 3 healthy (1, 2, 3) and 3 IOPD (A, B, C). c Tetanic force after 24 h of treatment with 5 µM chloroquine shown relative to vehicle control (n = 4–8 myobundles per donor). d Tetanic force in myobundles after 24 h of glucose starvation relative to unstarved control (n = 4 myobundles per donor). e Glycogen content remaining after 24 h of glucose starvation (n = 4 myobundles per donor). f Fraction of glycogen remaining after 24 h of glucose starvation relative to unstarved control (n = 4 myobundles per donor). g Schematic of glycogen metabolism in skeletal muscle through lysosomal GAA and rate-limiting cytosolic glycogen phosphorylase (GP) pathways. h Representative force traces during fatigue test (20 Hz stimulation for 30 s) normalized to value of peak force, shown after 24 h of treatment with the GP inhibitor CP-91149 (10 µM). i, j Percent force decline at the end of fatigue stimulation (i, n = 4 myobundles per donor), and area under normalized force curve during fatigue stimulation (j, n = 4 myobundles per donor) after 24 h of treatment with the GP inhibitor. Data: mean ± SEM. *p < 0.05; **p < 0.01; ***p < 0.001; ns not significant.

