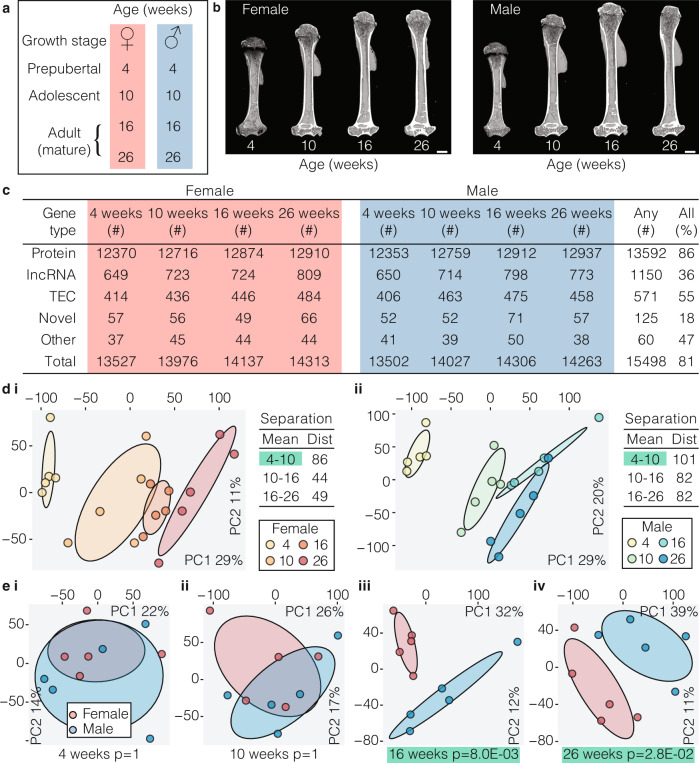
Fig. 2. The osteocyte transcriptome changes with sex and age.
a Experimental design used to define the osteocyte transcriptome in each sex during skeletal maturation. b Representative micro-CT images of humeri from female and male mice at different ages. c The number of active genes and biotype composition of the osteocyte transcriptome at different ages in each sex. Any reflects the number of genes actively expressed in any ages or sexes, All reflects the percentage of genes active in any age or sex that are active in all ages and sexes. TEC = to be experimentally confirmed. d Principal component (PC) analysis of samples clustered by age in female (i) and male (ii) mice. The percentage of total variance explained by individual PCs is shown. Dots represent individual biological replicates and ellipses represent 50% confidence intervals for each age. Dist = Euclidean distance between cluster centroids (mean). P-values were calculated using Hotelling’s t-test (one-sided, Bonferroni adjusted), clusters with significant separation (P < 0.05) between centroids are highlighted in green. e Principal component analysis of samples clustered from both sexes at 4 (i), 10 (ii), 16 (iii) and 26 (iv) weeks of age. The percentage of total variance explained by individual PCs is shown. Dots represent individual biological replicates and ellipses represent 50% confidence intervals for each sex. P-values were calculated using Hotelling’s t-test (one-sided, Bonferroni adjusted), clusters with significant separation (P < 0.05) between centroids are highlighted in green.

