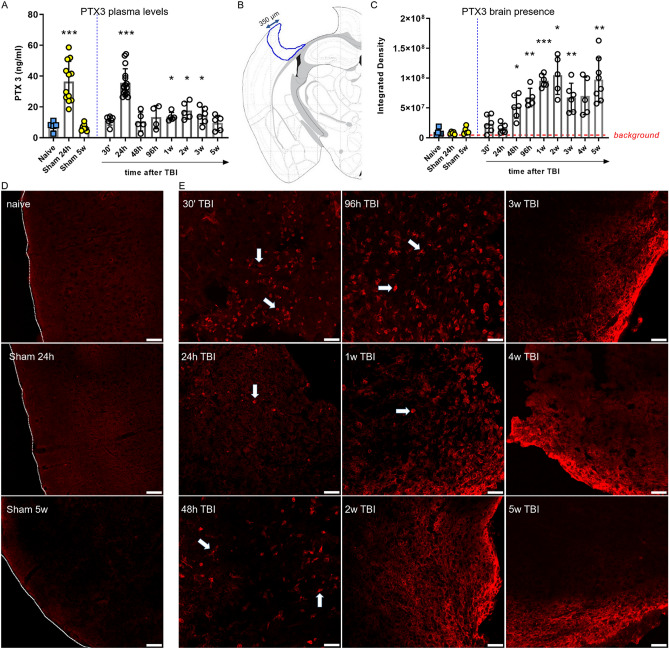
Figure 3.
PTX3 protein presence in plasma and in cortex up to 5 weeks after TBI. (A) At 24 h plasmatic PTX3 levels increased in both sham and TBI mice. PTX3 levels were significantly higher than naive from week 1 to week 3. Data is presented as mean ± SEM, n = 4 (TBI 96 h), n = 5 (naive, TBI: 48 h, 1w, 2w, 5w), n = 6 (TBI 30′, 3w), n = 16 (sham 24 h), n = 7 (sham 5w), n = 16 (TBI 24 h). Unequal variances per Bartlett’s test, t-test with Welch correction, *p < 0.05, ***p < 0.001, vs naive. (B) PTX3 presence in cortex was evaluated by immunofluorescence and quantified in a ROI placed in the il-cortex within the first 350 μm from the edge of the contusion (B). (C) PTX3 increased starting from 48 h and reached its maximum at 2 weeks after TBI. Data is presented as mean ± SEM, n = 5–6. Unequal variances per Bartlett’s test, one-way ANOVA with Welch correction, *p < 0.05, **p < 0.01, ***p < 0.001, vs naive. (D) Representative confocal microscopy images showing that PTX3 was not present in naïve or sham mice (sacrificed at 24 h and 5w). Tracings indicate the cortex edge, scale bars = 50 µm. (E) Representative confocal microscopy images showing PTX3 (red) presence next to cell-like shape (arrows) up to 1 week after injury, while it was located mainly extracellularly at longer time points (from 2 to 5w after TBI). Scale bars = 50 µm.

