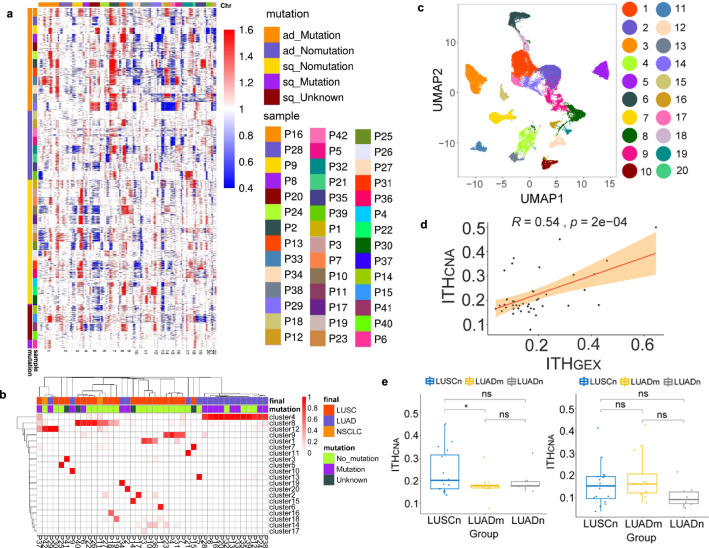
Fig. 2. Inter- and intratumor heterogeneity of cancer cells.
a Heatmap of CNA profiles inferred from scRNA-seq of tumor cells of patients. Red indicated genomic amplifications and blue indicated genomic deletions. The x-axis showed all chromosomes in the numerical order. The y-axis was marked by both patient subgroups. b Heatmap displaying proportions of cancer cells of each patient in cancer clusters. The clustering results of cancer cells were generated using resolution 0.4 in Seurat. The arrangement of the patients on the y-axis were based on their similarities using hierarchical clustering. c UMAP visualization of cancer cell clusters. The cluster IDs corresponded to cluster IDs shown in b. d Correlation between ITHCNA and ITHGEX for 42 patients. Shaded areas corresponded to the 0.95 confidence interval analyzed by two-sided t-test. e Statistical tests of ITHCNA and ITHGEX between patients in different groups, LUSCn, LUADm and LUADn (LUSCn: n = 16, LUADn: n = 6, LUADm: n = 12 biological independent samples. *p ≤ 0.05; ns: p > 0.05). Two-sided unpaired Wilcoxon test was performed to compare between groups. The lower hinge, middle line, and upper hinger of boxplots represented the first, second, and third quartiles of the distributions. The upper and lower whiskers corresponded to the largest and smallest data points within the 1.5 interquartile range. All actual data values were also plotted as dots alongside the boxplots.

