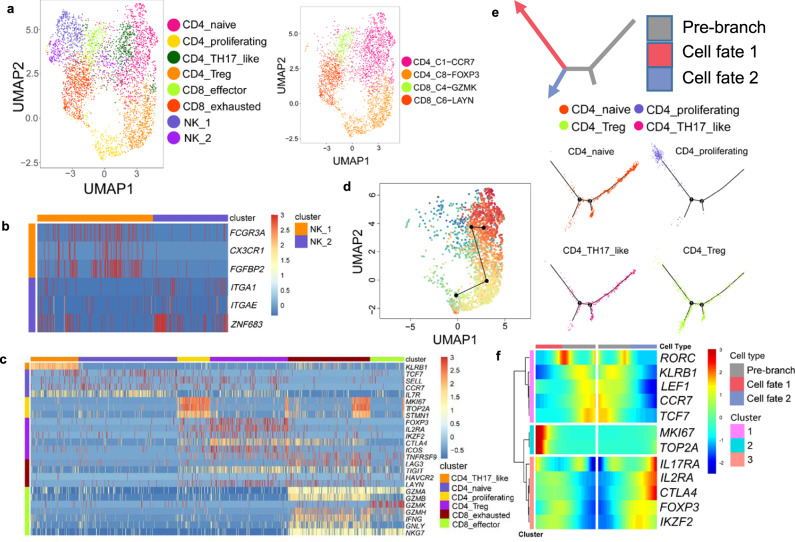
Fig. 4. Subtypes and developmental trajectory of T cells.
a UMAP visualization of 6 T cell subtypes and 2 NK cell subtypes (left) and predicted T cell subtypes by singleR (right). b Heatmap of selected markers for 2 NK clusters. c Heatmap of T subtype markers and selected functional genes. d Transitional relationship among CD4 T cells predicted by Slingshot. Rainbow coloring from red to blue represented the begin to end of the trajectory. e Illustration of CD4 T cell differentiation pathways inferred by Monocle and the relative locations of each CD4 T subtypes along the development pathways. The red and blue arrows indicated the two pseudotime directions of cell development. The grey section represented the beginning of the trajectory before the branching point. f Heatmap showing relative expressions of canonical markers of CD4 T cells along inferred trajectories. The red and blue branches correspond to the two developmental directions in e.

