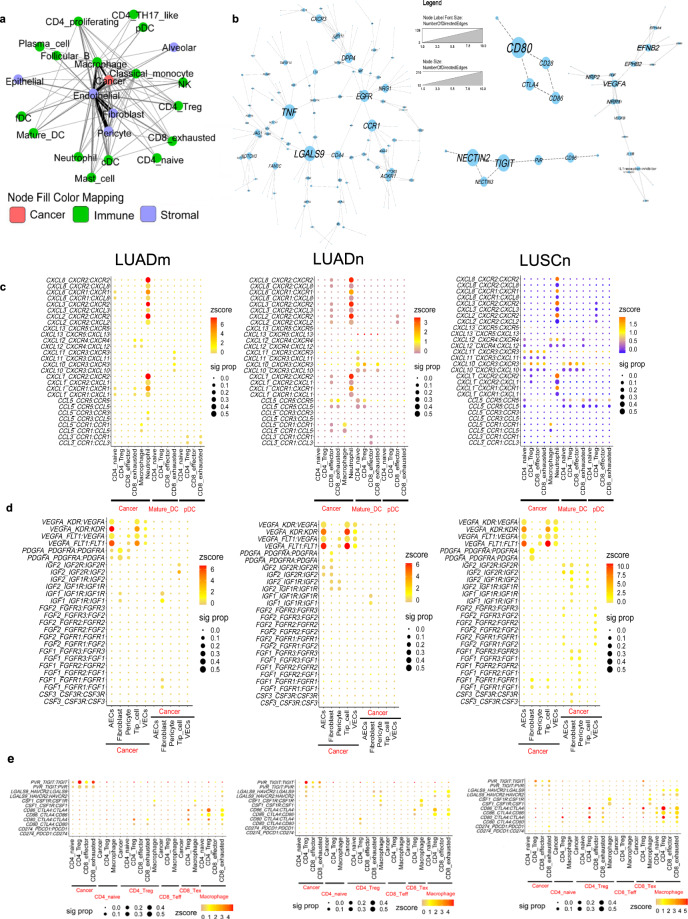
Fig. 6. Cell and gene interaction networks.
a The cellular interaction network among cell types of NSCLC patients. The line width and color were proportional to numbers of interactions between cell types. b Interacting molecular networks. Within each connected network, node (gene) sizes were proportional to the number of neighbors (interacting genes) of each node. Heatmaps shown selected interacting pairs for selected cell types in LUADm, LUADn, and LUSCn groups. Z-scores of expression levels were represented by color, and dot size displayed the proportion of patients who have significant interaction for the given ligand-receptor pair. c chemokine and chemokine receptors between cancer cells, T cells and DCs. d selected growth factors between cancer cells and stromal cells. e selected checkpoints between cancer cells, macrophages, and T cells.

