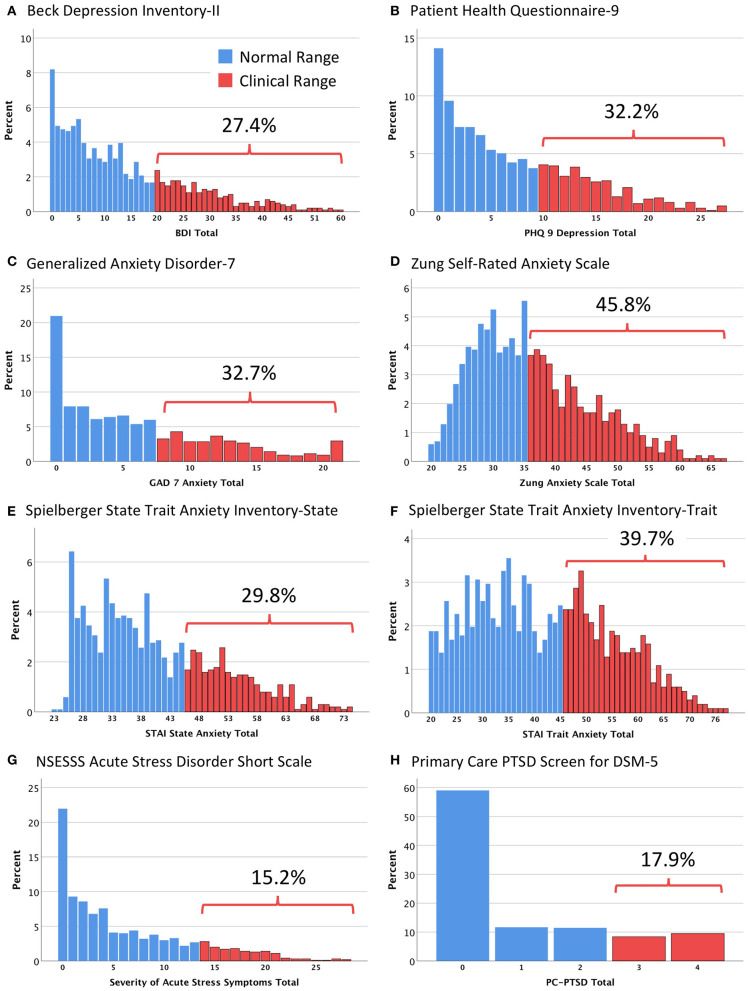
Figure 1.
Histograms showing the distribution of scores on the eight major mental health assessment questionnaires. (A) Beck Depression Inventory-II (BDI); (B) Patient Health Questionnaire-9 (PHQ 9); (C) Generalized Anxiety Disorder-7 (GAD 7); (D) Zung Self-Rated Anxiety Scale; (E) Spielberger State Trait Anxiety Inventory-State (STAI State); (F) Spielberger State Trait Anxiety Inventory-Trait (STAI Trait); (G) NSESSS Acute Stress Disorder Short Scale; (H) Primary Care PTSD Screen for DSM-5 (PC-PTSD). Bars represent the percentage of participants obtaining a particular score. Each histogram divides the sample into those who met published cut-off points for clinical significance (blue, normal range; red, clinical range).

