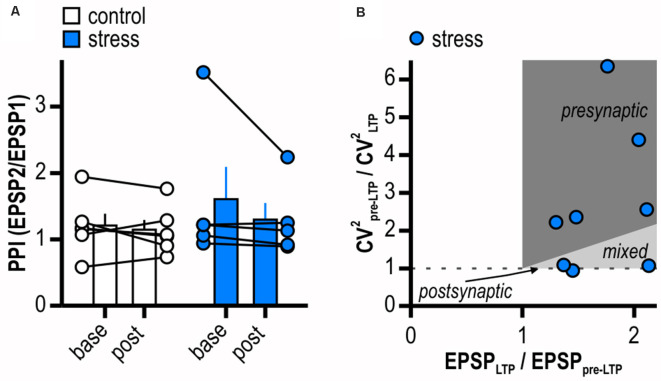
Figure 3.
LTP in stressed rats is expressed pre- and postsynaptically. (A) Quantification of paired-pulse index (PPI). Circles depict the mean value of single neurons before (base) and after (post) LTP induction, columns represent mean ± SEM of all recorded neurons. Paired-pulse index (PPI) does not change after induction of LTP in stressed rats (control: n = 6/5, paired Student’s t-test, p = 0.50; stress: n = 5/5, paired Student’s t-test, p = 0.28). (B) Plot relating the ratio of the coefficients of variation (CV) squared to the ratio of the mean EPSP amplitudes in stressed rats. Classically, for a single cell the locus for potentiation is postsynaptic when data is on horizontal line, presynaptic when above the identity line or both when between the horizontal and the identity line.

