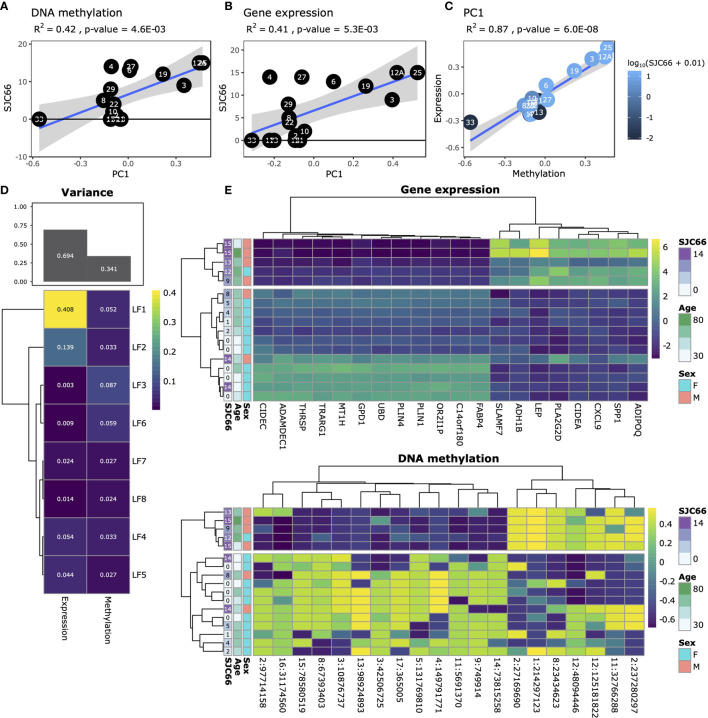
Figure 1.
Exploratory analysis. Analysis of SJC66 regressed onto the first principal component of (A) DNA methylation and (B) gene expression annotated with the Pearson r-squared (R2) and the p-value. (C) Comparison of the first principal components for DNA methylation on the x-axis and gene expression together coloured for SJC66. Trendlines represent the mean and 95% confidence intervals. (D) Results obtained from multi-omics factor analysis, where the figure at the top depicts a bar chart representing the percentage variance explained by gene expression and DNA methylation, which has been decomposed into the separate latent factors (LF) at the bottom. (E) Decomposition of the variance observed for LF1 into the loadings assigned by MOFA to the top 20 weighted features for gene expression (top; colours represent log2(count)) and DNA methylation (bottom; colours represent percentage methylation).

