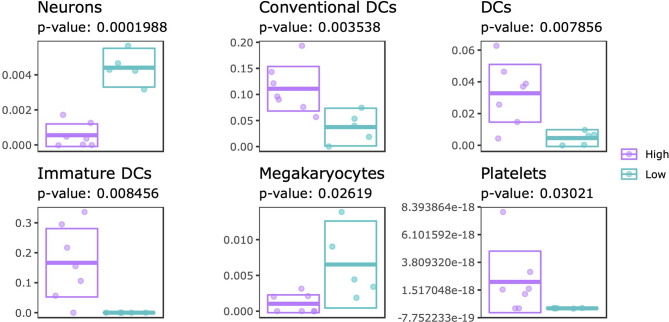
Figure 6.
Cellular composition estimation. Cellular proportions were estimated for 64 cell types using the xCell algorithm. Of these, 6 cell types were found to be significantly different when comparing SJC66high with SJC66low. Visualized as scatter- and cross-bar plots are the significantly differentially represented cell types, namely the neurons, conventional dendritic cells (cDC), dendritic cells (DC), immature dendritic cells (iDC), megakaryocytes, and platelets.

