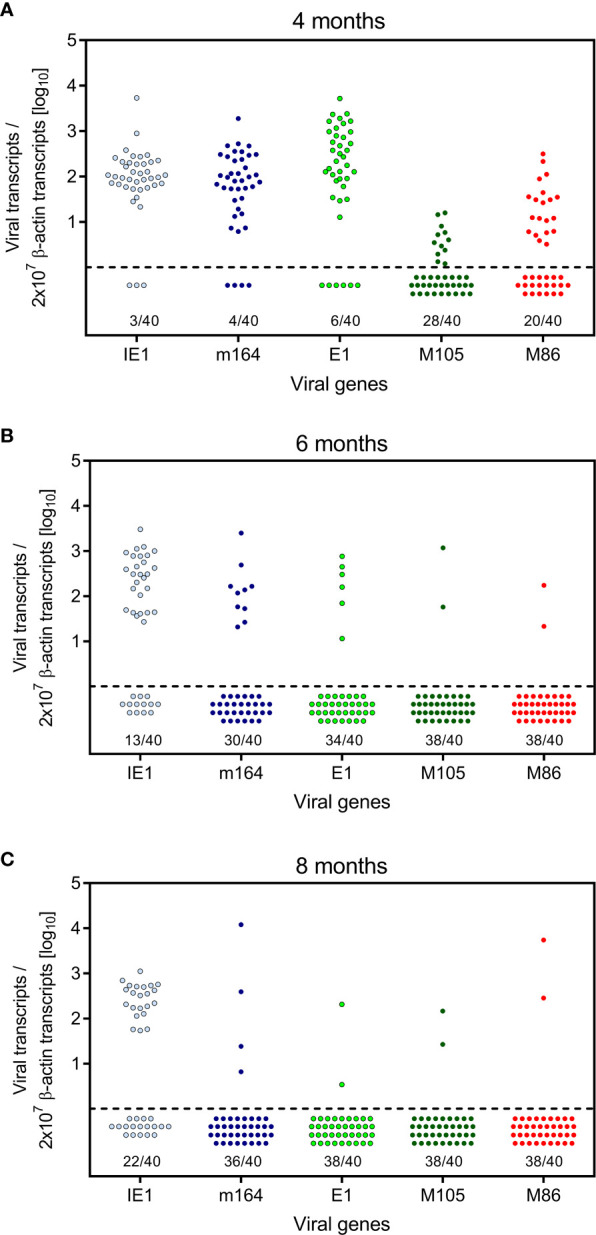
Figure 2.

Kinetics of viral transcriptional activity in latently infected lungs. Transcripts from the indicated IE, E, and L phase-marker genes were quantitated by RT-qPCR at (A) 4 months, (B) 6 months, and (C) 8 months after HCT and infection. Symbols represent data from lung tissue pieces p1-to-p8 of 5 mice, that is altogether 40 pieces per time of analysis. Pieces negative in the respective RT-qPCR are shown below the dashed line. The proportion F(0) of negative samples is indicated.
