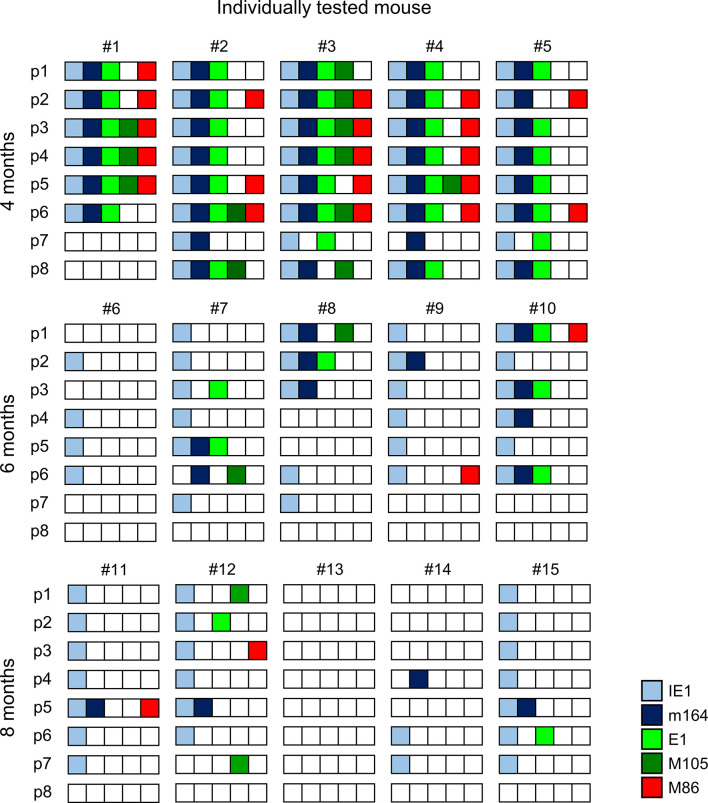
Figure 3.
Stochastic gene expression patterns in latently infected lungs. The quantitative gene expression data shown in Figure 2 were categorized into positive or negative for transcripts from the respective viral gene and were assigned to the lung tissue pieces p1-to-p8 of mice #1-to-#15. Boxes negative for the respective transcripts are left blank, boxes positive for the respective transcripts are shown color-coded as specified in the internal legend.

