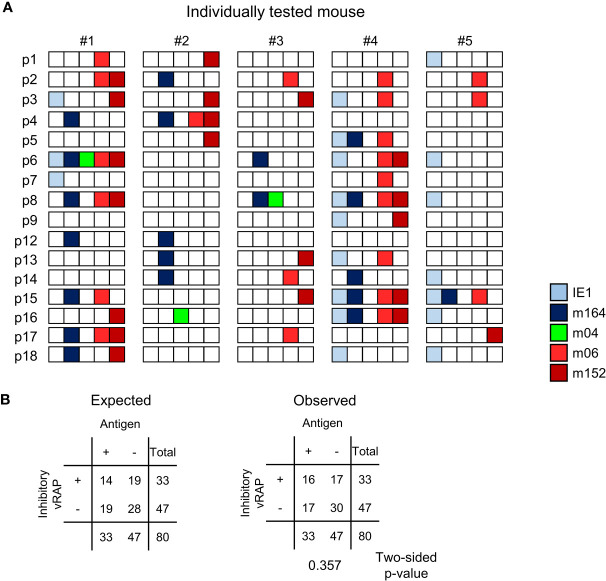
Figure 8.
Stochastic gene expression patterns of MI-driving and of vRAP-encoding genes in latently infected lungs. (A) The quantitative gene expression data, shown in Figure 7D exemplarily for mouse #1, were categorized for all five mice into positive or negative for transcripts from the respective viral gene and were assigned to the lung tissue pieces p1-to-p9 and p12-to-p18 of mice #1-to-#5. Boxes negative for the respective transcripts are left blank, boxes positive for the respective transcripts are shown color-coded as specified in the internal legend. (B) Expected and observed 2 x 2 contingency tables for the expression of MI-driving antigens (IE1 and m164 combined) and of immunoevasive vRAPs (m06 and m152 combined) for testing the null hypothesis of independent distribution with Fisher’s Exact Probability Test. The null hypothesis is accepted for p >0.05.

