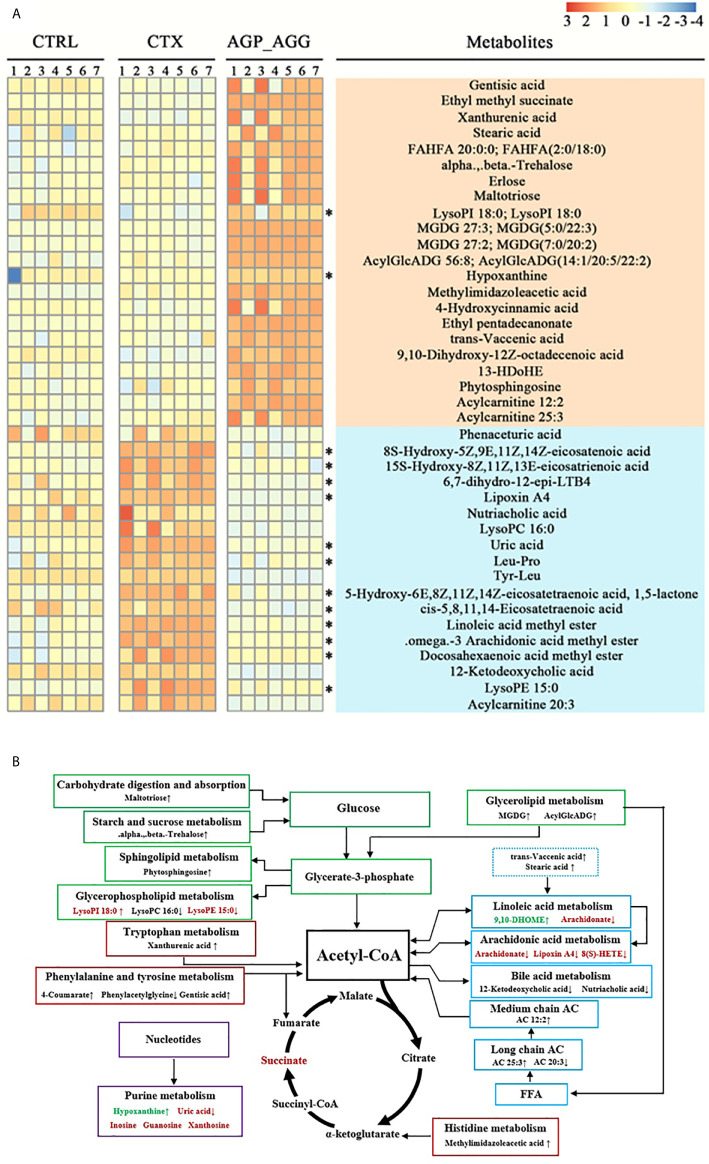
Figure 8.
Heatmap and metabolic network analysis of the identified metabolites. (A) Heatmaps of the differential metabolites that were altered by CTX compared with AGP_AGG mice. Asterisks represent metabolites whose abundance in CTRL mice was altered by CTX and then regulated by AGP_AGG. (B) The profile of metabolic network analysis of the identified metabolites based on the known metabolic pathways. Red color represents significantly increased metabolites in CTX group, while green represents decreased dramatically, compared to CTRL group. “↑↓” describes metabolites that were significantly up- or down-regulated after AGP_AGG treatment. FFA, free fatty acid; AC, acylcarnitine; CTRL, control group; CTX, cyclophosphamide-induced immunosuppressive group; AGP_AGG, American ginseng polysaccharide+American ginseng ginsenoside with cyclophosphamide-induced immunosuppressive group.

