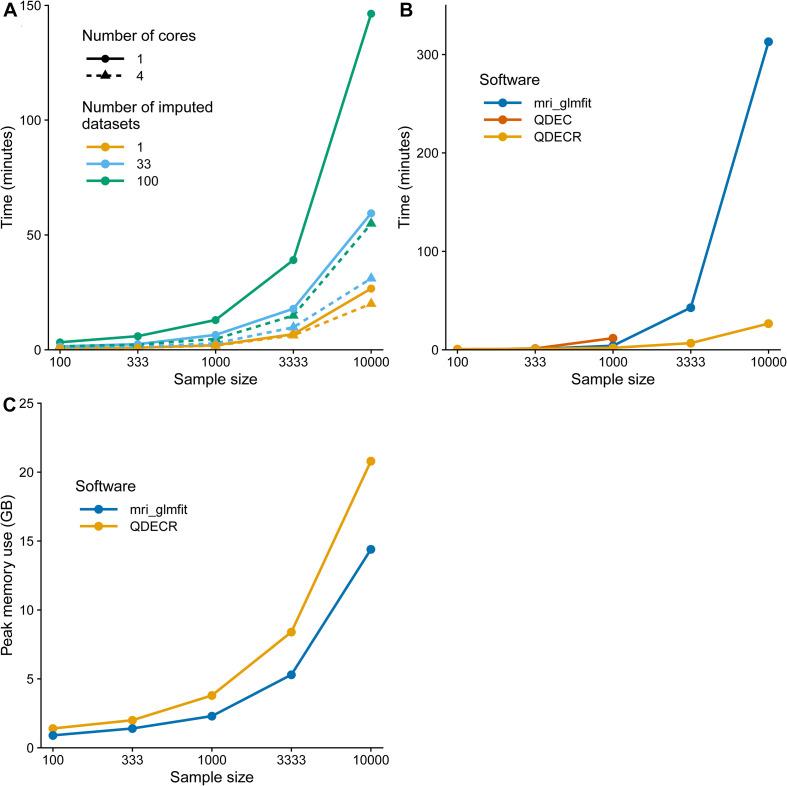
FIGURE 4.
Computation time benchmark of the QDECR package. (A) Displays the computation time of an analysis with QDECR when varying sample size, number of cores (threads) used and number of imputed datasets that were included. (B) Compares the computation time for mri_glmfit, QDEC and QDECR when using a single core (thread) and unimputed data. For QDEC we used the time that the analysis took, without loading or assembling of the data or the multiple testing correction. For mri_glmfit we measured the time it took to run three commands: (Fan and Markram, 2019) mri_preproc to assemble the FreeSurfer output, (Wright et al., 1995) mri_glmfit to run the analysis and (Dale and Sereno, 1993) mri_glmfit-sim to perform the multiple testing correction. **Note: QDEC returned errors when attempting to run the analyses on 3,333 and 10,000 participants and is thus not represented for those sample sizes in panel (B). (C) Compares the peak memory use in gigabytes (GB) for mri_glmfit and QDECR when using a single core (thread) and unimputed data.

