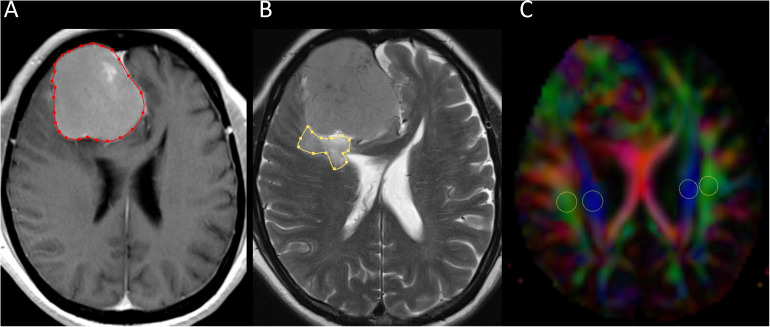
FIGURE 1.
Example of how regions of interest (ROIs) were segmented. Transverse contrast-enhanced T1-weighted (A) and T2-weighted (B) images show manually drawn ROIs for measurement of meningioma and peritumoral brain edema volumes. Directionally encoded color map (C) illustrates ROIs of projection (blue area) and association (green area) fibers in bilateral periventricular regions.

