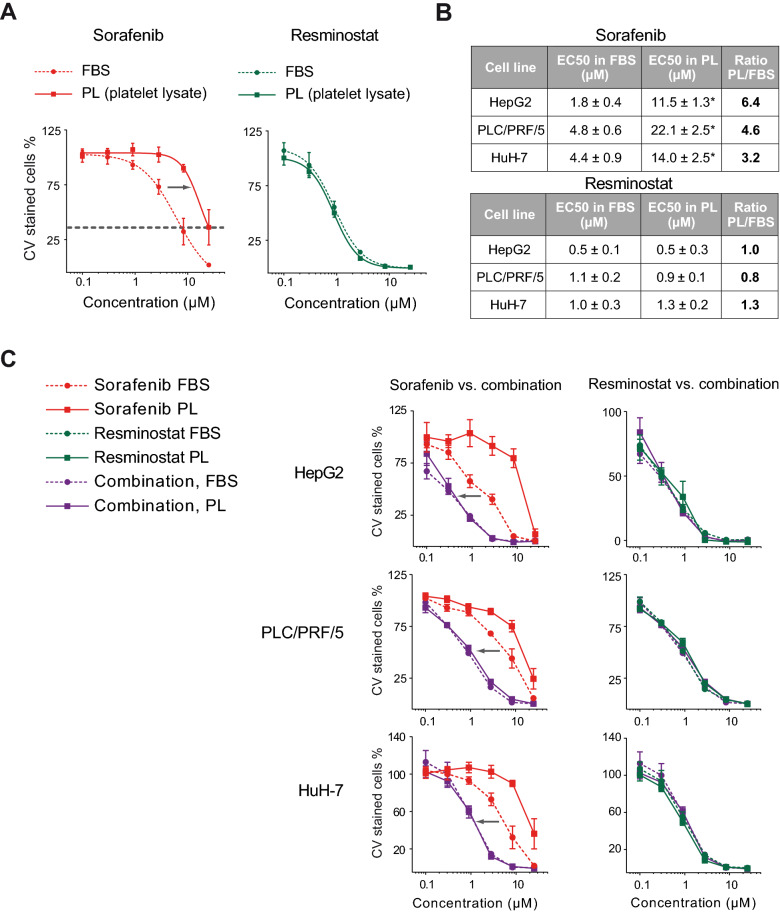
Figure 2.
The efficacy of the resminostat plus sorafenib combination is determined by resminostat and is independent of platelet factors. (A) Proliferation assays in PLC/PRF/5 cells in the presence of fetal bovine serum (FBS) or platelet lysate (PL). The grey arrow indicates a shift in the sorafenib dose-response curve towards higher concentrations under the PL condition. Maximum inhibition at the highest concentration of 25 µM was not reached with PL (grey dotted line) compared to FBS. The data are presented as mean ± SD (n = 5). (B) EC50 data of sorafenib and resminostat in the presence of FBS or PL in three epithelial HCC cells lines. The absolute EC50 values (*) and the ratio of PL/FBS EC50s are shown. The data are presented as mean ± SD (n ≥ 4). One-way ANOVA with multiple comparison testing (Tukey) was performed. Multiplicity adjusted p-values with 95% confidence interval was applied: Differences in EC50 values for resminostat treatment with FBS compared to PL in HepG2, PLC/PRF/5 and HuH-7 were not significant. For sorafenib treatment with FBS compared to PL, the p-values were < 0.0001 in all three cell lines. (C) Proliferation assay in HepG2, PLC/PRF/5 and HuH-7 cells in the presence of FBS or PL. Dose-response curves from 0.1 to 25 µM comparing sorafenib mono-treatment with resminostat/sorafenib combination (left-side graphs) or resminostat mono-treatment with resminostat/sorafenib combination (right-side graph). The grey arrow indicates a difference in the potency of the drug combination compared to sorafenib. The data are presented as mean ± SD (n ≥ 4).

