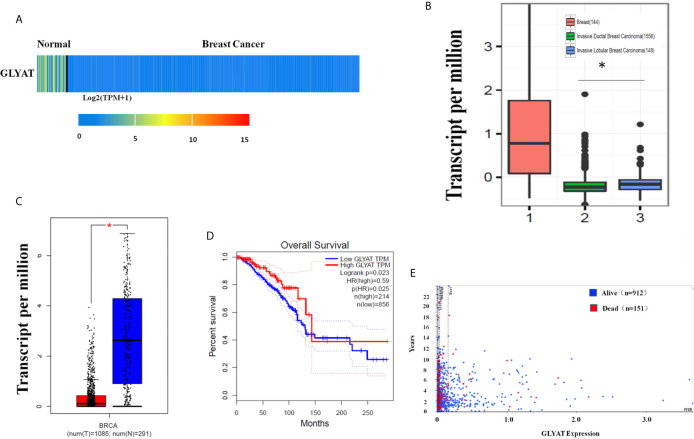
Figure 1.
Characterization of GLYAT expression profiling in human breast cancer. (A) Heatmaps showing the clustering patterns of differentially expressed GLYAT between normal and breast cancer specimens. (B) Box plot analysis of the GLYAT mRNA levels in IDBC, ILBC and normal breast tissue samples. (C) Box plot analysis of the GLYAT mRNA levels in BC and NC tissues. T, tumor; N, normal. (D, E) Kaplan-Meier plots of OS in BC patients with different levels of GLYAT. *p < 0.05.

