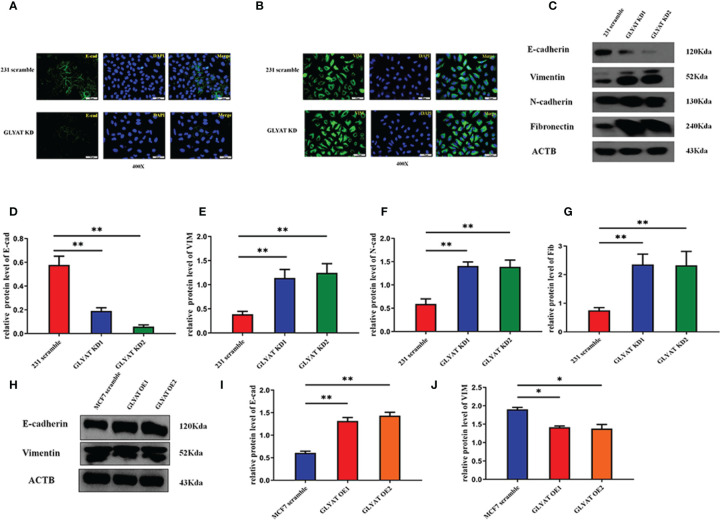
Figure 3.
GLYAT suppress EMT phenotype in BC cells. (A, B) Immunofluorescence assay showed that E-cadherin expression was decreased and the vimentin expression was increased after the treatment of GLYAT KD. (C–G) Protein levels of E-cadherin was reduced, whereas the levels of Vimentin, N-cadherin, and Fibronectin were increased in MDA-MB-231 cells following GLYAT inhibition. (H–J) Protein levels of E-cadherin was increased whereas the expression of Vimentin was reduced in GLYAT OE MCF-7 cells. *p < 0.05, **p < 0.01. Scale bars are 25μm.

