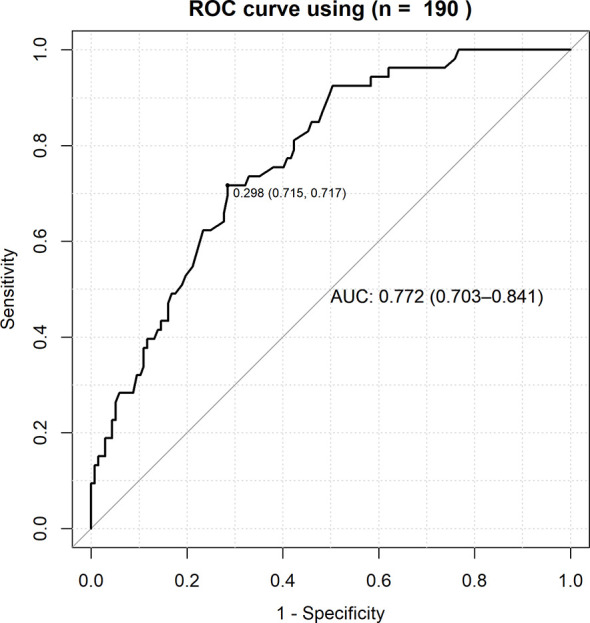
Figure 3.

ROC curve for the combined effects of HLA-A*11:01:01:01, age and sex with the severity of COVID-19. True positive rate (sensitivity) was plotted against false positive rate (1-specificity) and the AUC (Area Under Curve) of a risk prediction model that includes HLA-A*11:01:01:01, age, and sex was 0.772, with sensitivity of 0.715.
