
Figure 4.
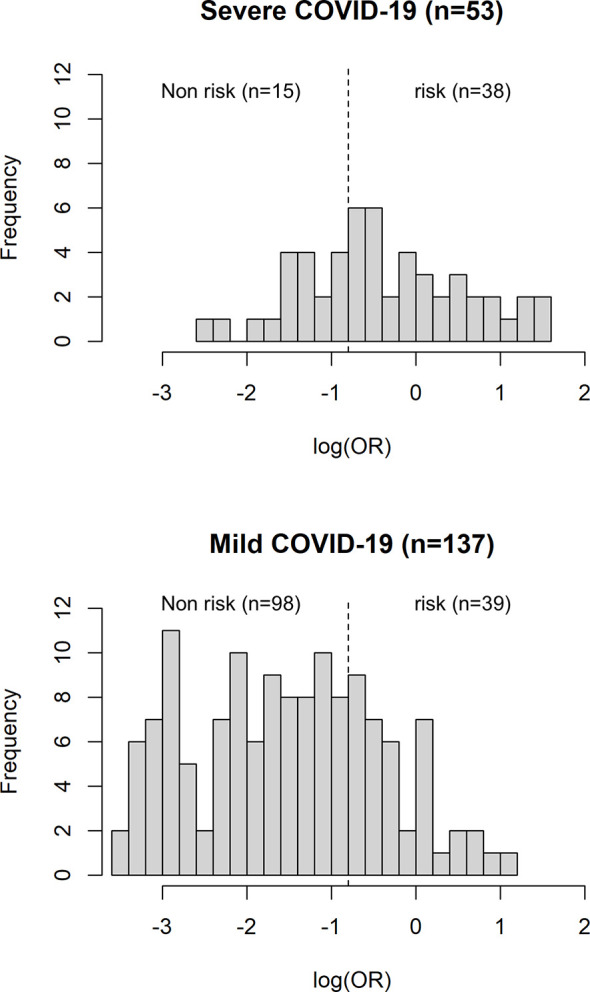
Histogram plot of case-control count versus distribution of log (OR). The dotted line representing the threshold of the plot is obtained from the AUC with optimal sensitivity and specificity. A significant difference (P = 5.22E-08) was observed between risk and non-risk of case-control in this study, with an odds ratio of 6.37 (95%CI = 3.15–12.86).