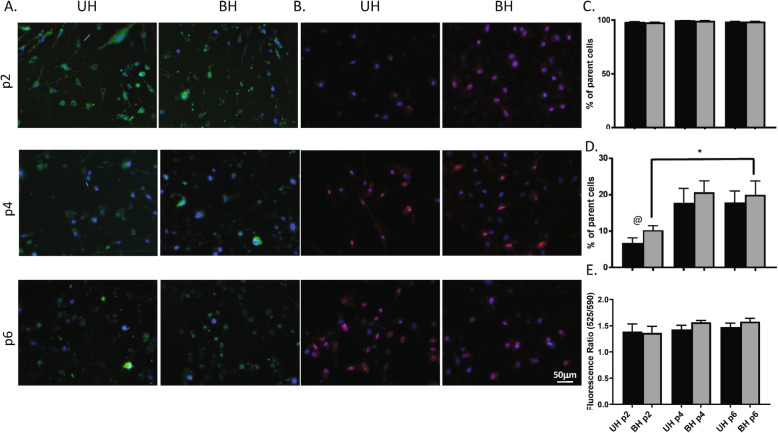
Fig. 2.
Mitochondrial characteristics of ASCs in culture. Representative images of staining for MitoTracker (a) and MitoSOX (b) for BH and UH ASCs across passages show relatively consistent quantities of mitochondrial content in green but increasing amount of ROS with passaging in red. Quantification of these fluorescent dyes via flow cytometry shows that nearly all ASCs in both groups stained positive for MitoTracker (c), while MitoSOX (d) expression increased significantly in passage 6 compared to passage 2 in BH ASCs. *P < 0.05. BH ASCs also displayed more MitoSox-positive cells than UH ASCs at passage 2, @P < 0.05. e The mitochondrial membrane potential dye, JC-10, was not different between the groups or passages. N = 6 patients in BH ASCs and UH ASCs at each passage

