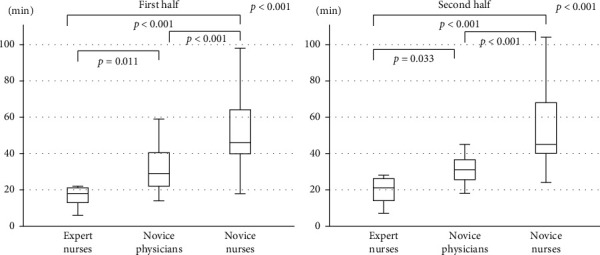
Figure 1.

Comparisons of the reading time between the first half of videos and the second half of videos among the three groups (expert nurses, novice physicians, and novice nurses). Horizontal bars are the medians, boxes represent the 25th–75th interquartile ranges, and vertical lines indicate the range of values; p values are obtained by the Kruskal–Wallis analysis.
