Figure 2.

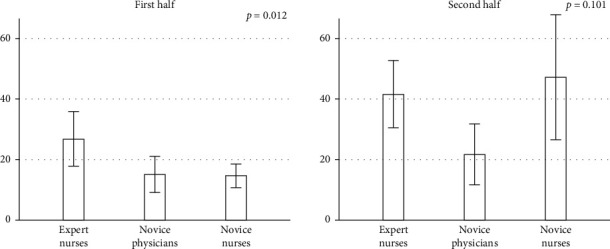
Comparisons of the number of thumbnails between the first half and the second half among the three groups. Data are mean, and error bars represent standard error (SE). p values are obtained by one-way factorial analysis of variance.

Comparisons of the number of thumbnails between the first half and the second half among the three groups. Data are mean, and error bars represent standard error (SE). p values are obtained by one-way factorial analysis of variance.