
Figure 3.
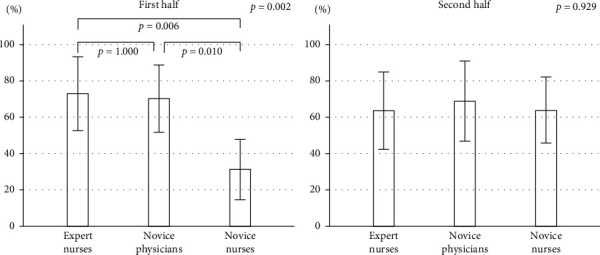
Comparisons of the small polyp detection rate between the first half and the second half among the three groups. Data are mean (%), and error bars represent SE. p values are obtained by one-way factorial analysis of variance.
Official websites use .gov
A
.gov website belongs to an official
government organization in the United States.
Secure .gov websites use HTTPS
A lock (
) or https:// means you've safely
connected to the .gov website. Share sensitive
information only on official, secure websites.
Comparisons of the small polyp detection rate between the first half and the second half among the three groups. Data are mean (%), and error bars represent SE. p values are obtained by one-way factorial analysis of variance.