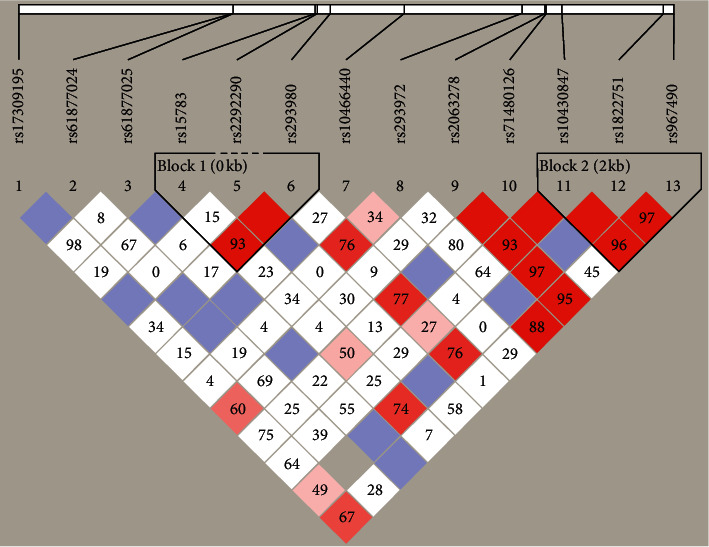
Figure 2.

Graphical representation of the SNP locations and LD structure of MUC15. The SNP distribution and haplotype block structure across the MUC15 genes are shown, respectively. The measure of LD (D2) among all possible pairs of SNPs is shown graphically according to the shade of color, where white represents very low D2 and dark represents very high D2.
