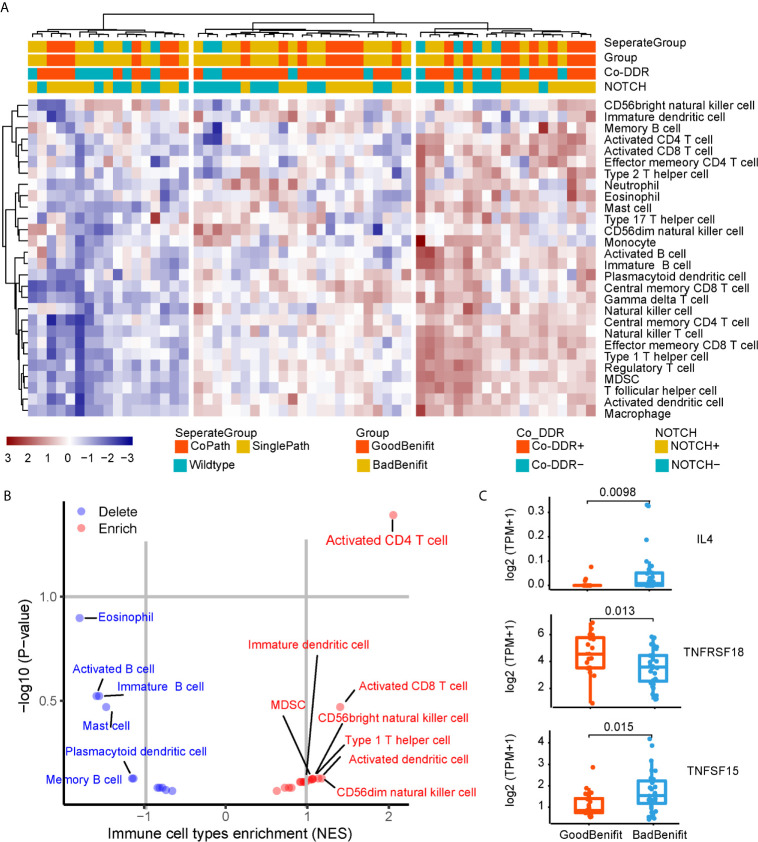
Figure 5.
Immunobiology features of NOTCH/co-DDR co-occurrence. (A) Heatmap of immune infiltration in each patient. (B) Volcano plots for the enrichment (red) and depletion (blue) of immune cell types for GoodBenefit and BadBenefit. The expression levels of genes were first z-score normalized across all patients. Then we calculated the mean z-scores for each group and ranked in descending order. Based on the pre-ranked GSEA method, for each immune cell signature, we defined the q-value <10% and NES >0 as the enrichment, while the q-value <10% and NES <0 as the depletion. Immune cells with absolute NES greater than 1 were shown. (C) Normalized express of immune-related genes between Goodbenefit versus Badbenefit.

