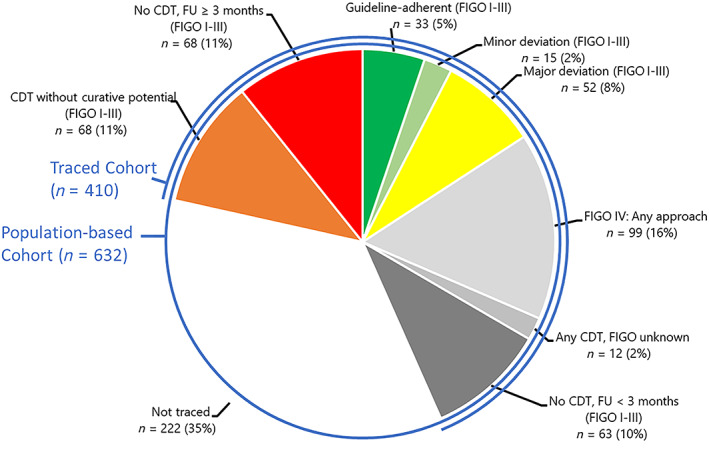
Figure 2.

Therapy evaluation in the population‐based cohort (n = 632). Evaluations refer to the therapy evaluation scheme in Table 1. Colors depict the degree of adherence: green indicates optimal, light green minor deviation, yellow major deviation, orange CDT without curative potential, and red no CDT. Light gray indicates patients with FIGO stage IV, middle and darker gray indicates missing stage or observation time, and no color indicates untraced patients. Patients with hospital files found or successful telephone contact were considered to be traced.Abbreviations: CDT, cancer‐directed therapy; FIGO, International Federation of Gynecology and Obstetrics; FU, follow‐up (time of observation since diagnosis).
